| __timestamp | Equifax Inc. | Snap-on Incorporated |
|---|---|---|
| Wednesday, January 1, 2014 | 842400000 | 767600000 |
| Thursday, January 1, 2015 | 914600000 | 848900000 |
| Friday, January 1, 2016 | 1116900000 | 942400000 |
| Sunday, January 1, 2017 | 1013900000 | 971900000 |
| Monday, January 1, 2018 | 770200000 | 1057400000 |
| Tuesday, January 1, 2019 | 29000000 | 1067000000 |
| Wednesday, January 1, 2020 | 1217800000 | 991400000 |
| Friday, January 1, 2021 | 1575200000 | 1249100000 |
| Saturday, January 1, 2022 | 1672800000 | 1351500000 |
| Sunday, January 1, 2023 | 1579100000 | 1478800000 |
| Monday, January 1, 2024 | 1251200000 | 1520700000 |
Unleashing the power of data
In the ever-evolving landscape of financial metrics, EBITDA (Earnings Before Interest, Taxes, Depreciation, and Amortization) serves as a crucial indicator of a company's operational efficiency. This analysis juxtaposes the EBITDA performance of Equifax Inc. and Snap-on Incorporated from 2014 to 2023.
Equifax Inc. demonstrated a remarkable growth trajectory, with its EBITDA surging by approximately 87% over the decade, peaking in 2022. Notably, 2019 was an outlier year with a significant dip, which was swiftly recovered in subsequent years. Meanwhile, Snap-on Incorporated maintained a steady upward trend, achieving a 93% increase in EBITDA by 2023.
This comparative analysis highlights the resilience and strategic prowess of both companies in navigating economic challenges and capitalizing on growth opportunities. Investors and stakeholders can glean valuable insights into the financial health and future potential of these industry giants.
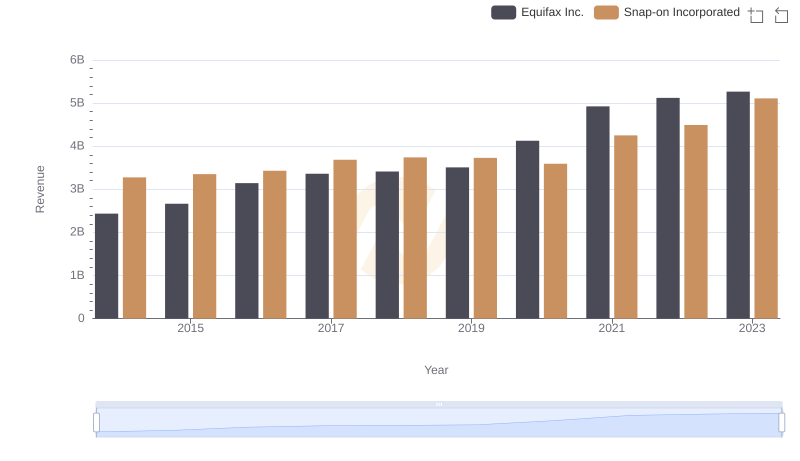
Breaking Down Revenue Trends: Equifax Inc. vs Snap-on Incorporated
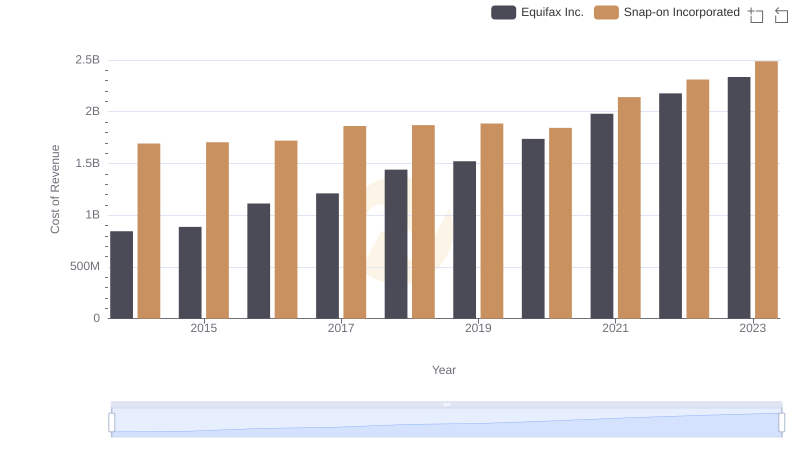
Equifax Inc. vs Snap-on Incorporated: Efficiency in Cost of Revenue Explored
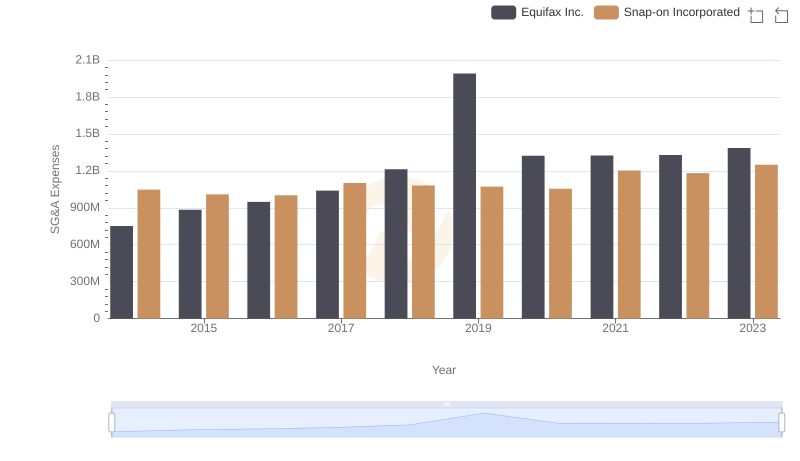
Breaking Down SG&A Expenses: Equifax Inc. vs Snap-on Incorporated
Comparative EBITDA Analysis: Equifax Inc. vs Stanley Black & Decker, Inc.
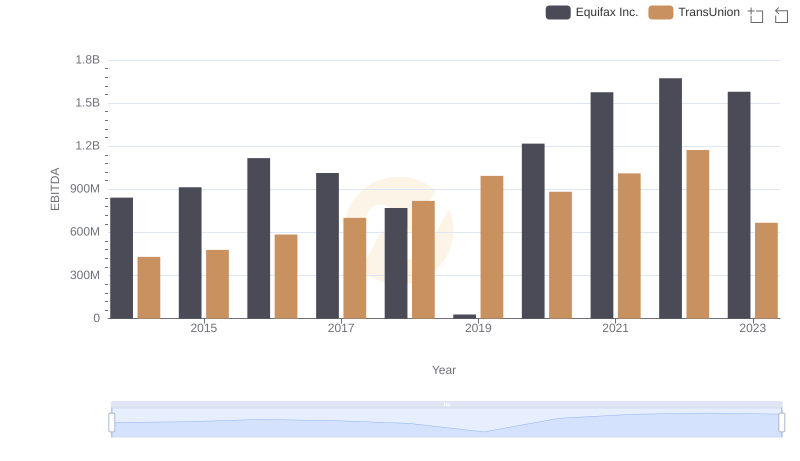
EBITDA Performance Review: Equifax Inc. vs TransUnion
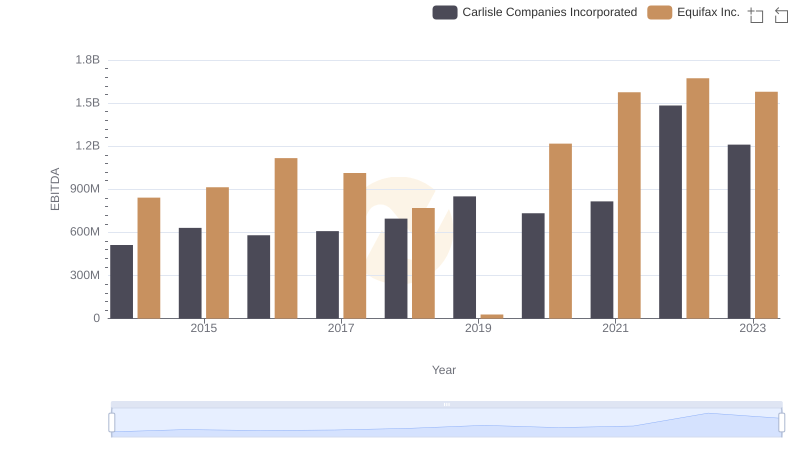
Comparative EBITDA Analysis: Equifax Inc. vs Carlisle Companies Incorporated
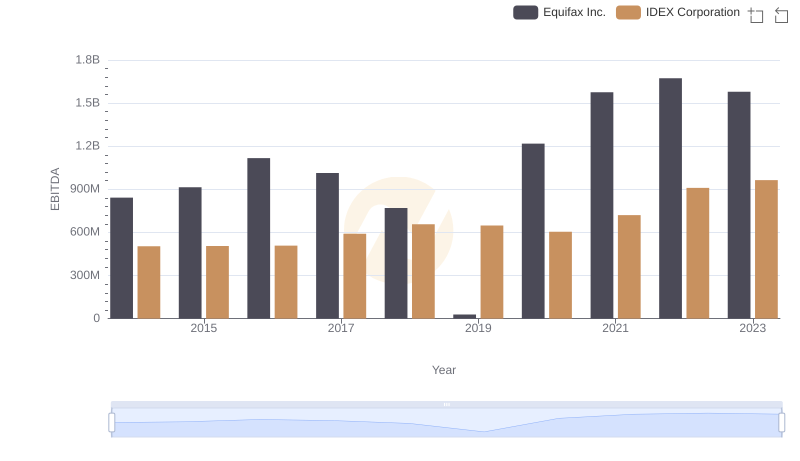
Equifax Inc. and IDEX Corporation: A Detailed Examination of EBITDA Performance