| __timestamp | Equifax Inc. | Snap-on Incorporated |
|---|---|---|
| Wednesday, January 1, 2014 | 751700000 | 1047900000 |
| Thursday, January 1, 2015 | 884300000 | 1009100000 |
| Friday, January 1, 2016 | 948200000 | 1001400000 |
| Sunday, January 1, 2017 | 1039100000 | 1101300000 |
| Monday, January 1, 2018 | 1213300000 | 1080700000 |
| Tuesday, January 1, 2019 | 1990200000 | 1071500000 |
| Wednesday, January 1, 2020 | 1322500000 | 1054800000 |
| Friday, January 1, 2021 | 1324600000 | 1202300000 |
| Saturday, January 1, 2022 | 1328900000 | 1181200000 |
| Sunday, January 1, 2023 | 1385700000 | 1249000000 |
| Monday, January 1, 2024 | 1450500000 | 0 |
In pursuit of knowledge
In the ever-evolving landscape of corporate finance, understanding the nuances of Selling, General, and Administrative (SG&A) expenses is crucial. Over the past decade, Equifax Inc. and Snap-on Incorporated have demonstrated distinct trajectories in their SG&A expenditures. From 2014 to 2023, Equifax's SG&A expenses surged by approximately 84%, peaking in 2019, while Snap-on's expenses exhibited a more stable pattern, with a modest increase of about 19% over the same period. This divergence highlights Equifax's aggressive investment in administrative capabilities, possibly driven by its need to enhance data security and compliance post-2017. Meanwhile, Snap-on's steady approach reflects its focus on operational efficiency. As businesses navigate the complexities of financial management, these insights offer valuable lessons in balancing growth with fiscal responsibility.
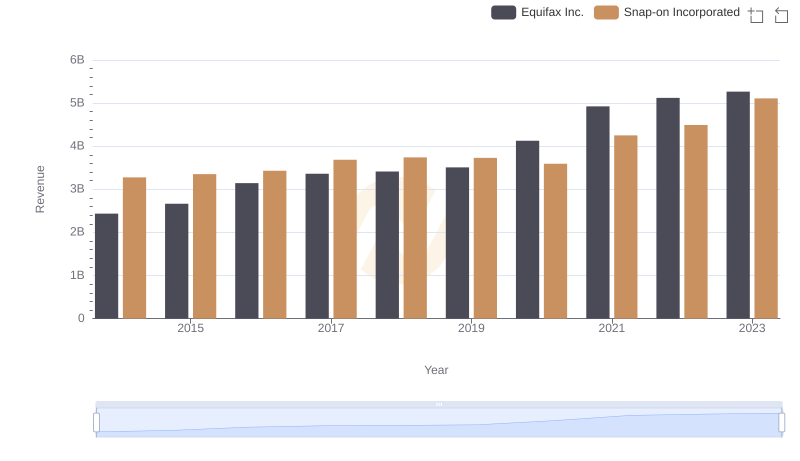
Breaking Down Revenue Trends: Equifax Inc. vs Snap-on Incorporated
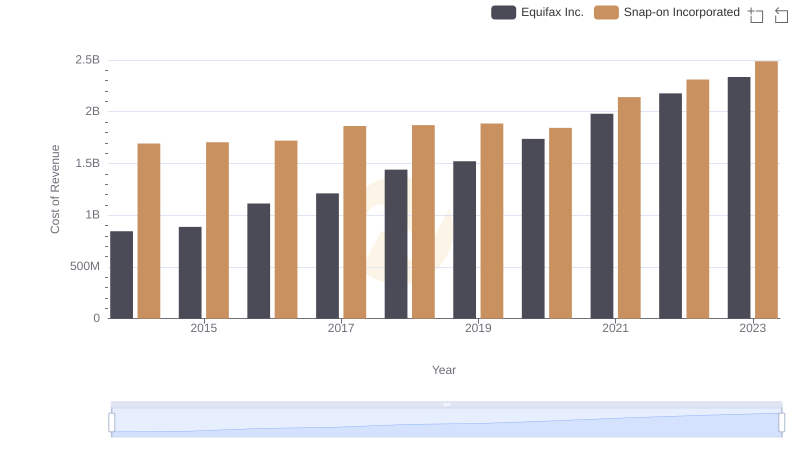
Equifax Inc. vs Snap-on Incorporated: Efficiency in Cost of Revenue Explored
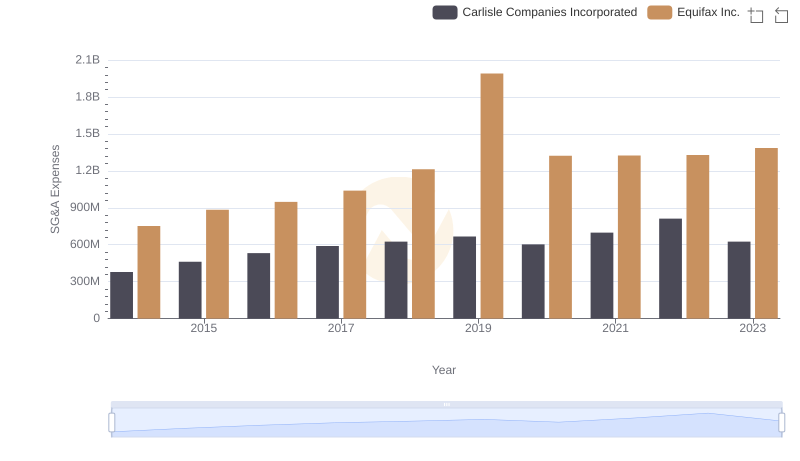
Selling, General, and Administrative Costs: Equifax Inc. vs Carlisle Companies Incorporated
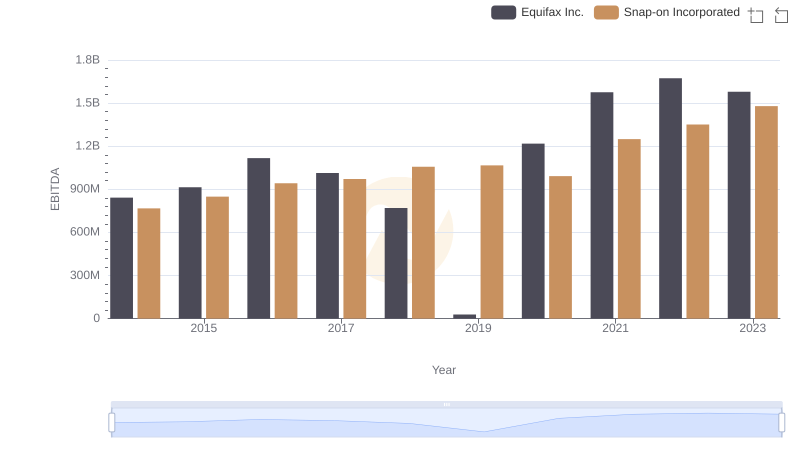
EBITDA Metrics Evaluated: Equifax Inc. vs Snap-on Incorporated
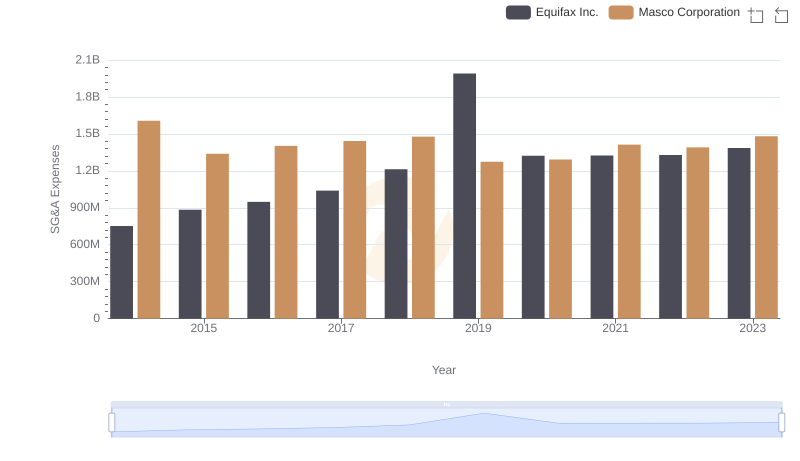
Who Optimizes SG&A Costs Better? Equifax Inc. or Masco Corporation
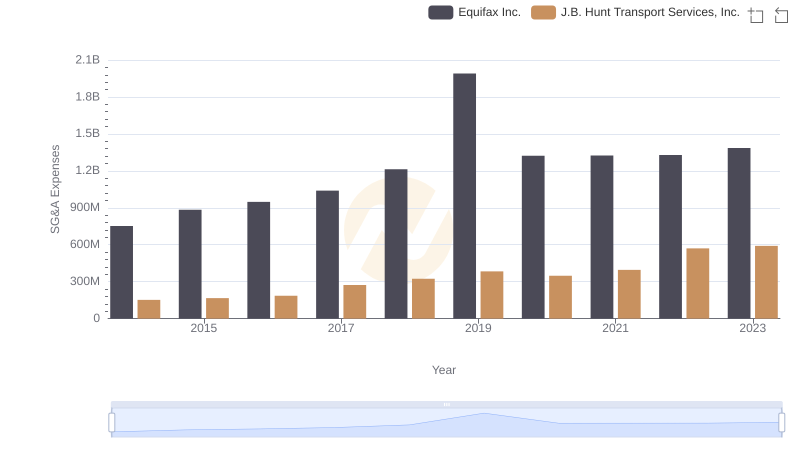
Breaking Down SG&A Expenses: Equifax Inc. vs J.B. Hunt Transport Services, Inc.
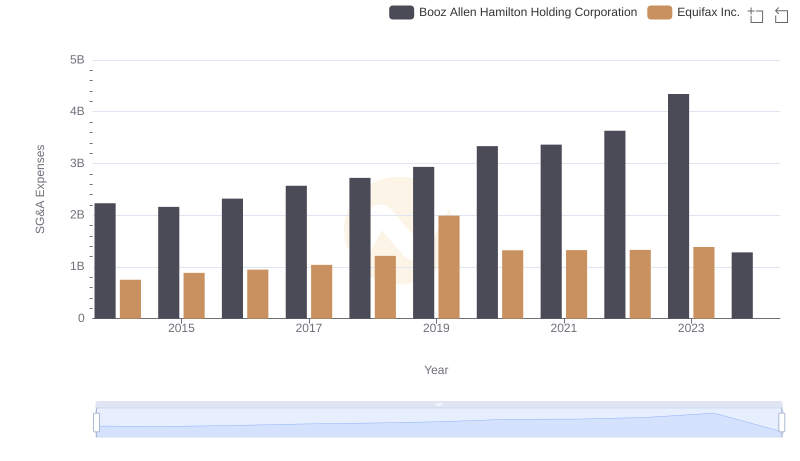
Equifax Inc. and Booz Allen Hamilton Holding Corporation: SG&A Spending Patterns Compared