| __timestamp | Equifax Inc. | TransUnion |
|---|---|---|
| Wednesday, January 1, 2014 | 842400000 | 429400000 |
| Thursday, January 1, 2015 | 914600000 | 478200000 |
| Friday, January 1, 2016 | 1116900000 | 585300000 |
| Sunday, January 1, 2017 | 1013900000 | 701100000 |
| Monday, January 1, 2018 | 770200000 | 819800000 |
| Tuesday, January 1, 2019 | 29000000 | 993200000 |
| Wednesday, January 1, 2020 | 1217800000 | 883400000 |
| Friday, January 1, 2021 | 1575200000 | 1010500000 |
| Saturday, January 1, 2022 | 1672800000 | 1173800000 |
| Sunday, January 1, 2023 | 1579100000 | 667300000 |
| Monday, January 1, 2024 | 1251200000 | 1204100000 |
Cracking the code
In the competitive landscape of credit reporting agencies, Equifax Inc. and TransUnion have shown distinct EBITDA trajectories over the past decade. From 2014 to 2023, Equifax's EBITDA grew by approximately 87%, peaking in 2022. This growth reflects strategic investments and market expansion. In contrast, TransUnion's EBITDA increased by about 173% during the same period, with a notable surge in 2022, indicating robust operational efficiency and market penetration.
This analysis highlights the dynamic shifts in the credit reporting industry, driven by strategic decisions and market conditions.
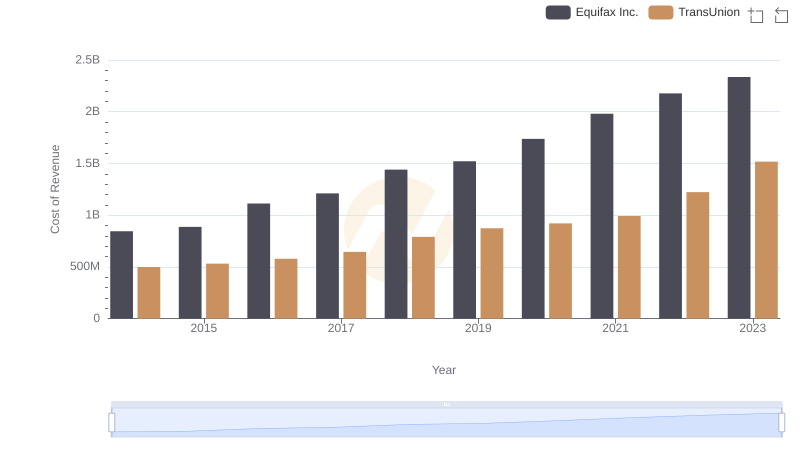
Analyzing Cost of Revenue: Equifax Inc. and TransUnion
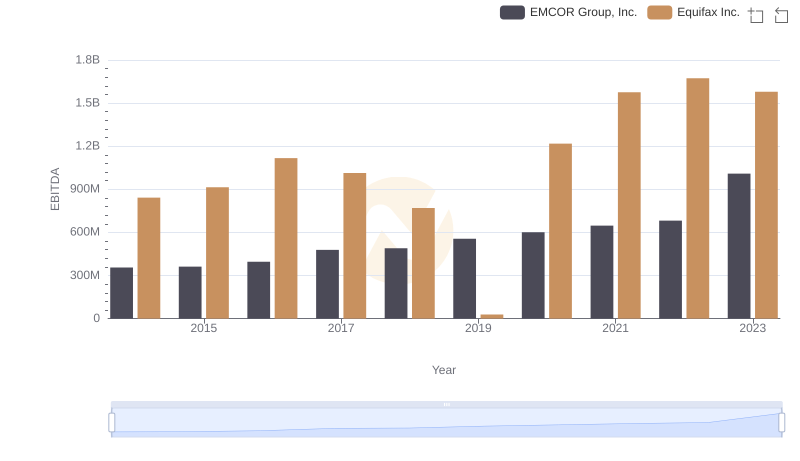
Equifax Inc. and EMCOR Group, Inc.: A Detailed Examination of EBITDA Performance
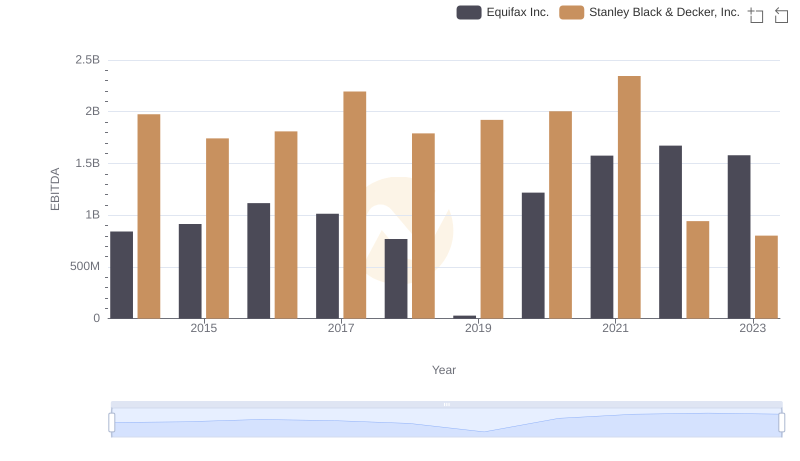
Comparative EBITDA Analysis: Equifax Inc. vs Stanley Black & Decker, Inc.
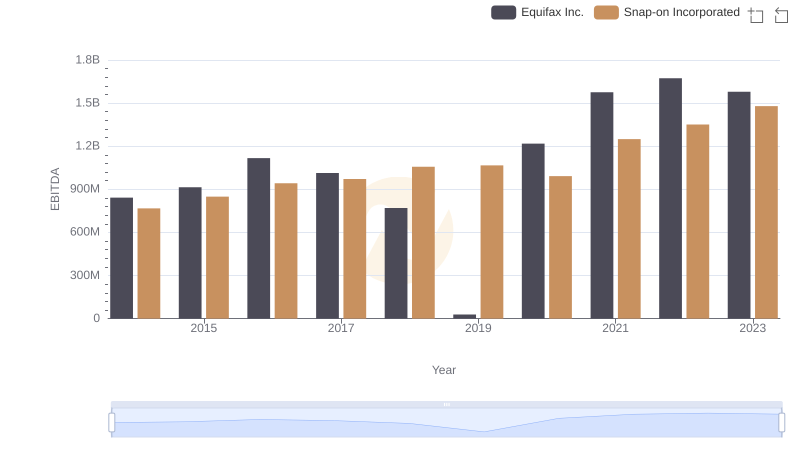
EBITDA Metrics Evaluated: Equifax Inc. vs Snap-on Incorporated
Comparative EBITDA Analysis: Equifax Inc. vs Carlisle Companies Incorporated