| __timestamp | Automatic Data Processing, Inc. | Lockheed Martin Corporation |
|---|---|---|
| Wednesday, January 1, 2014 | 2616900000 | 6592000000 |
| Thursday, January 1, 2015 | 2355100000 | 5687000000 |
| Friday, January 1, 2016 | 2579500000 | 6716000000 |
| Sunday, January 1, 2017 | 2927200000 | 7092000000 |
| Monday, January 1, 2018 | 2762900000 | 7667000000 |
| Tuesday, January 1, 2019 | 3544500000 | 9083000000 |
| Wednesday, January 1, 2020 | 3769700000 | 10116000000 |
| Friday, January 1, 2021 | 3931600000 | 9483000000 |
| Saturday, January 1, 2022 | 4405500000 | 8707000000 |
| Sunday, January 1, 2023 | 5244600000 | 10444000000 |
| Monday, January 1, 2024 | 5800000000 | 8815000000 |
Unlocking the unknown
In the ever-evolving landscape of corporate finance, EBITDA (Earnings Before Interest, Taxes, Depreciation, and Amortization) serves as a crucial metric for evaluating a company's operational performance. Over the past decade, Automatic Data Processing, Inc. (ADP) and Lockheed Martin Corporation have showcased contrasting trajectories in their EBITDA growth.
From 2014 to 2023, ADP's EBITDA has seen a remarkable increase of approximately 123%, rising from $2.6 billion to $5.2 billion. This consistent growth underscores ADP's robust business model and strategic initiatives.
Conversely, Lockheed Martin's EBITDA journey has been more volatile. Despite a peak in 2020, reaching nearly $10.1 billion, the company's EBITDA in 2023 stands at $10.4 billion, reflecting a modest 58% growth over the decade.
These insights highlight the diverse financial strategies and market conditions influencing these industry giants.
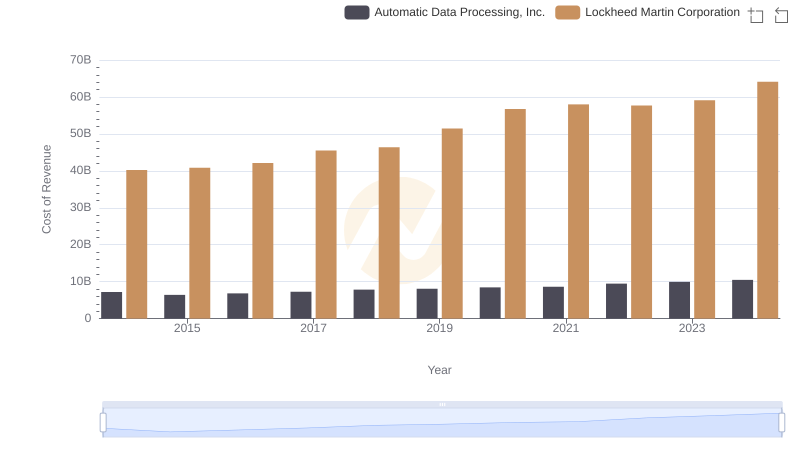
Cost of Revenue Trends: Automatic Data Processing, Inc. vs Lockheed Martin Corporation
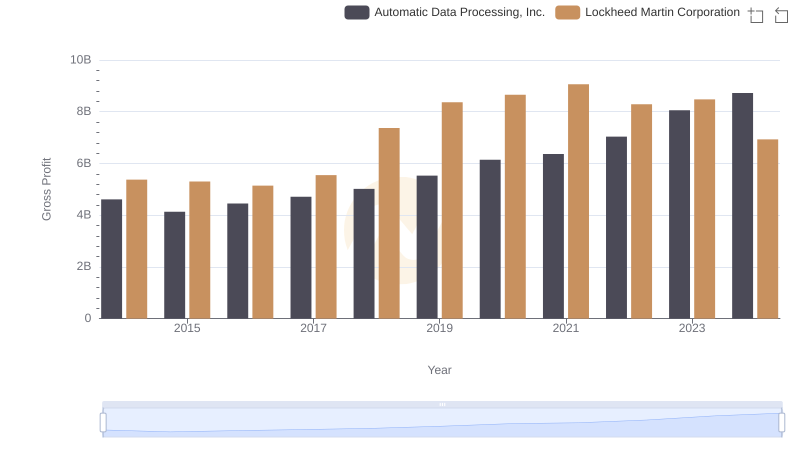
Automatic Data Processing, Inc. vs Lockheed Martin Corporation: A Gross Profit Performance Breakdown
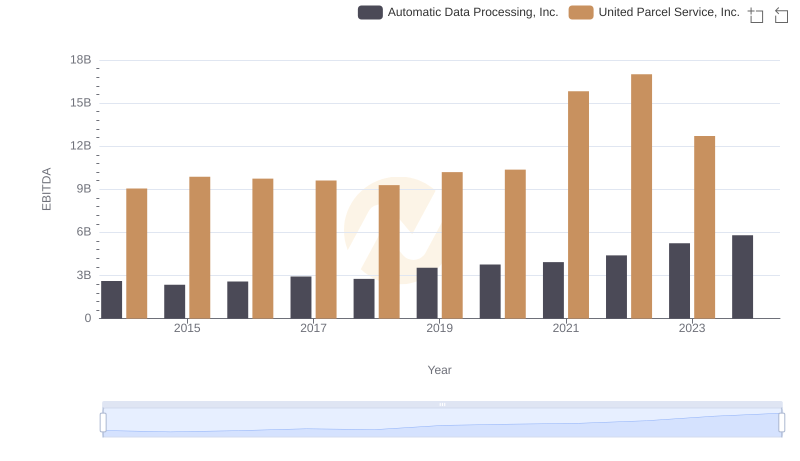
A Side-by-Side Analysis of EBITDA: Automatic Data Processing, Inc. and United Parcel Service, Inc.
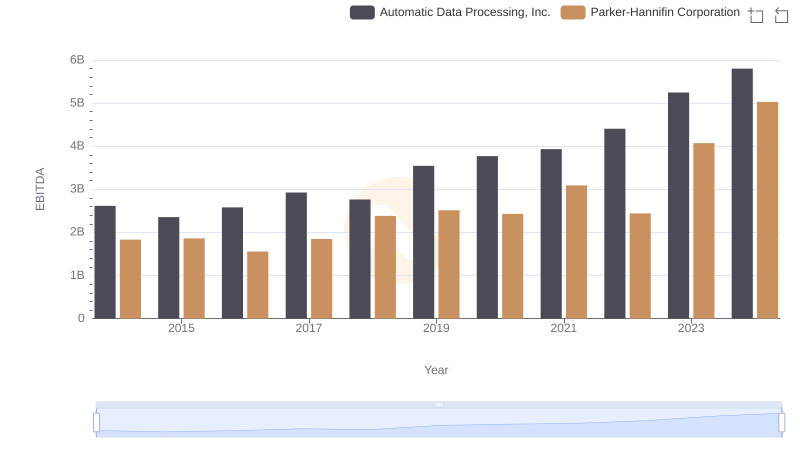
EBITDA Performance Review: Automatic Data Processing, Inc. vs Parker-Hannifin Corporation
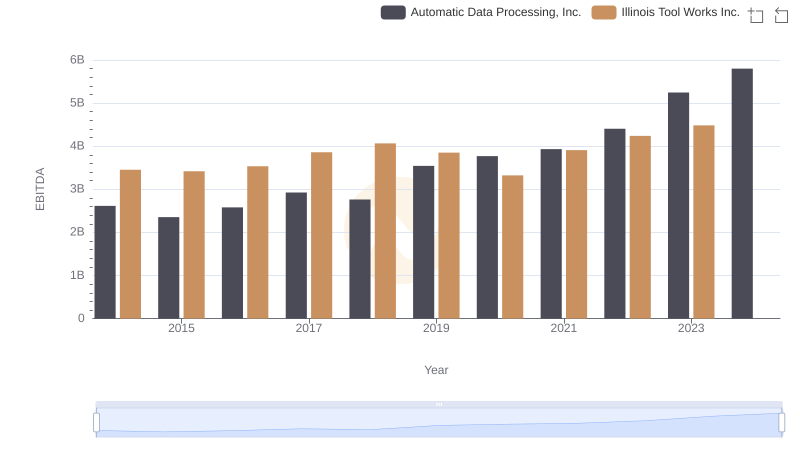
A Professional Review of EBITDA: Automatic Data Processing, Inc. Compared to Illinois Tool Works Inc.
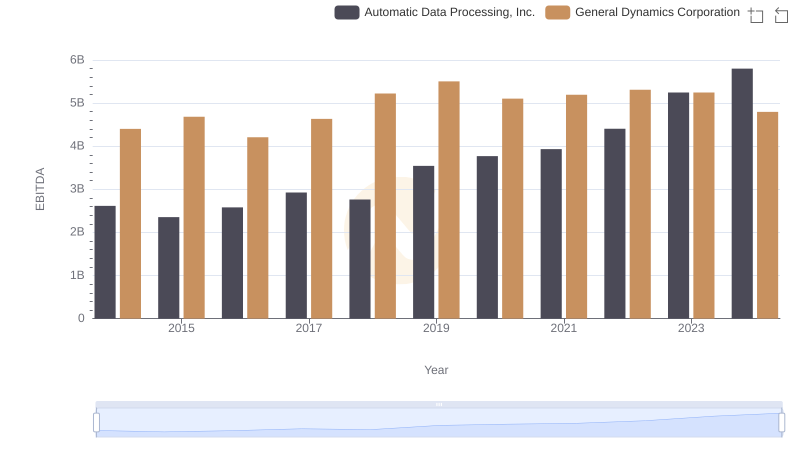
A Professional Review of EBITDA: Automatic Data Processing, Inc. Compared to General Dynamics Corporation
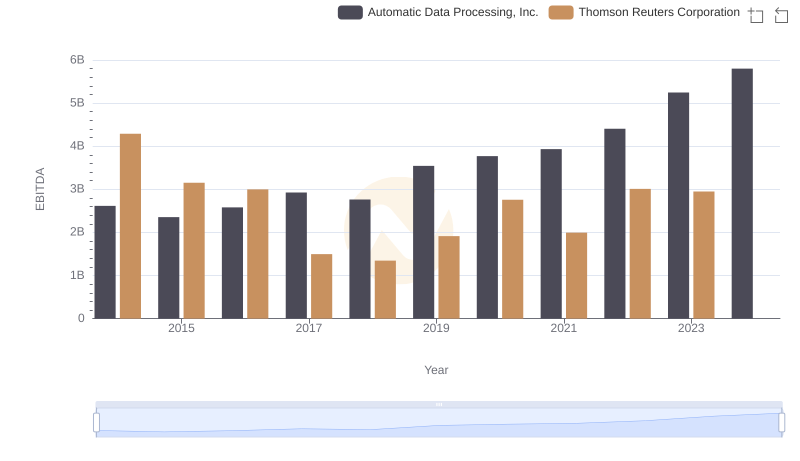
EBITDA Analysis: Evaluating Automatic Data Processing, Inc. Against Thomson Reuters Corporation
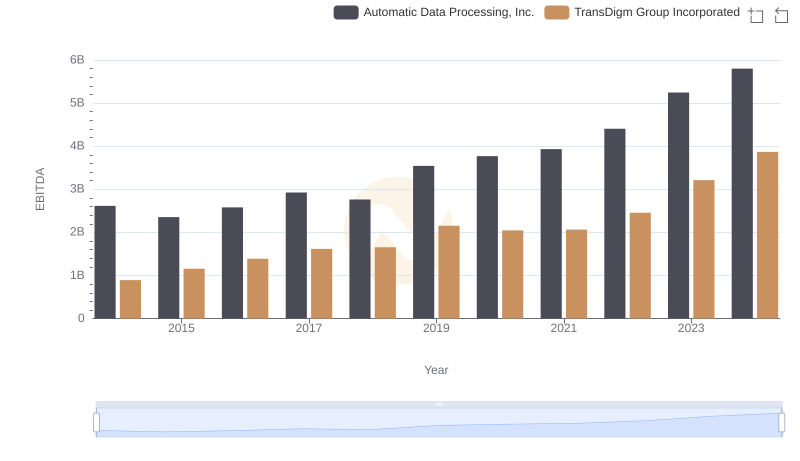
Professional EBITDA Benchmarking: Automatic Data Processing, Inc. vs TransDigm Group Incorporated