| __timestamp | Automatic Data Processing, Inc. | Illinois Tool Works Inc. |
|---|---|---|
| Wednesday, January 1, 2014 | 2616900000 | 3453000000 |
| Thursday, January 1, 2015 | 2355100000 | 3420000000 |
| Friday, January 1, 2016 | 2579500000 | 3534000000 |
| Sunday, January 1, 2017 | 2927200000 | 3861000000 |
| Monday, January 1, 2018 | 2762900000 | 4065000000 |
| Tuesday, January 1, 2019 | 3544500000 | 3852000000 |
| Wednesday, January 1, 2020 | 3769700000 | 3322000000 |
| Friday, January 1, 2021 | 3931600000 | 3910000000 |
| Saturday, January 1, 2022 | 4405500000 | 4241000000 |
| Sunday, January 1, 2023 | 5244600000 | 4484000000 |
| Monday, January 1, 2024 | 5800000000 | 4264000000 |
Unlocking the unknown
In the ever-evolving landscape of corporate finance, EBITDA serves as a crucial metric for evaluating a company's operational performance. Over the past decade, Automatic Data Processing, Inc. (ADP) and Illinois Tool Works Inc. (ITW) have showcased intriguing trends in their EBITDA figures. From 2014 to 2023, ADP's EBITDA surged by approximately 122%, reflecting its robust growth strategy and operational efficiency. In contrast, ITW experienced a more modest increase of around 30% during the same period, highlighting its steady yet conservative approach.
These insights offer a compelling narrative of two industry giants navigating the financial tides with distinct strategies.
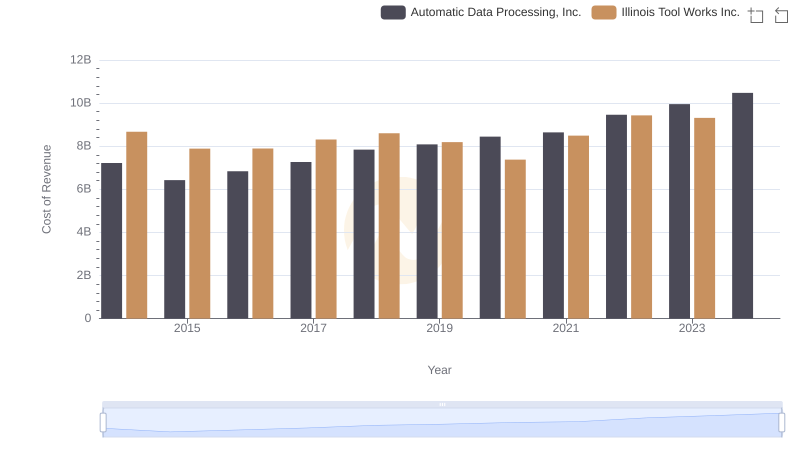
Comparing Cost of Revenue Efficiency: Automatic Data Processing, Inc. vs Illinois Tool Works Inc.
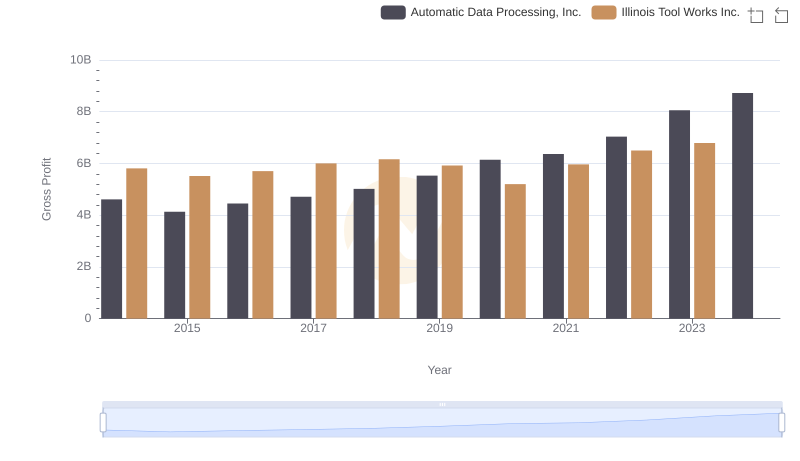
Gross Profit Trends Compared: Automatic Data Processing, Inc. vs Illinois Tool Works Inc.
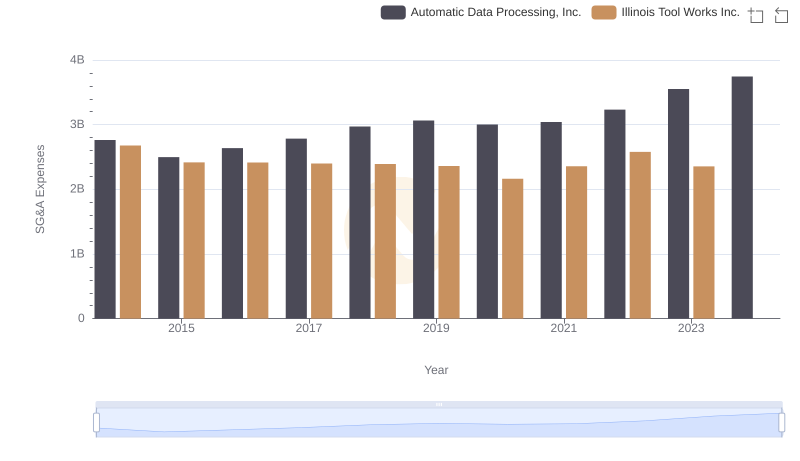
SG&A Efficiency Analysis: Comparing Automatic Data Processing, Inc. and Illinois Tool Works Inc.
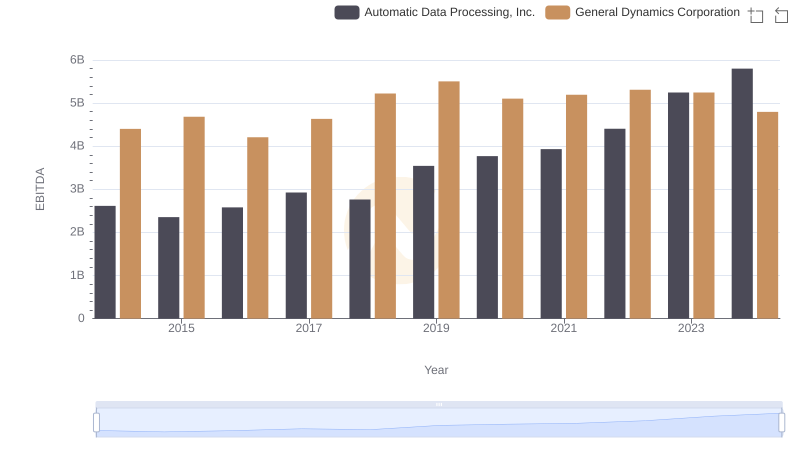
A Professional Review of EBITDA: Automatic Data Processing, Inc. Compared to General Dynamics Corporation
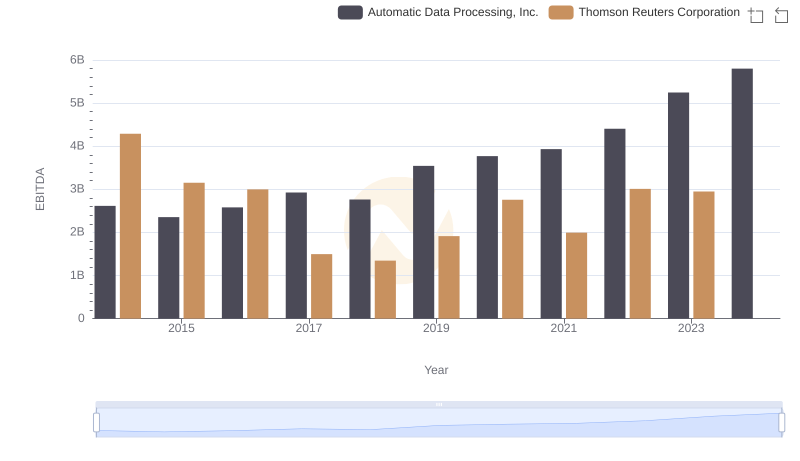
EBITDA Analysis: Evaluating Automatic Data Processing, Inc. Against Thomson Reuters Corporation
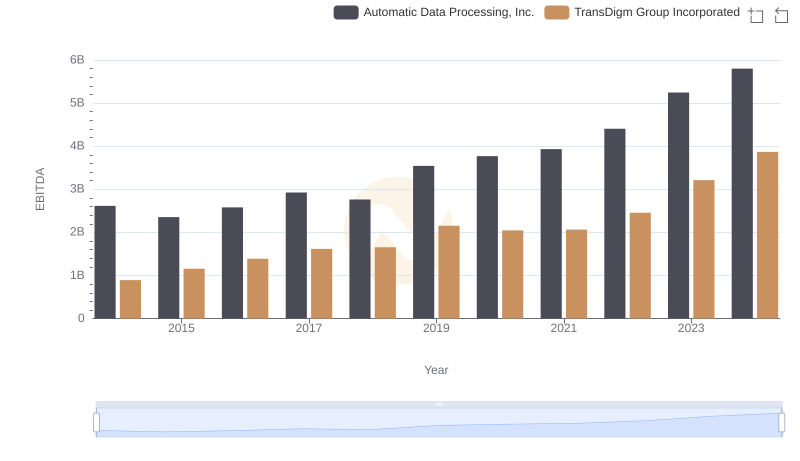
Professional EBITDA Benchmarking: Automatic Data Processing, Inc. vs TransDigm Group Incorporated
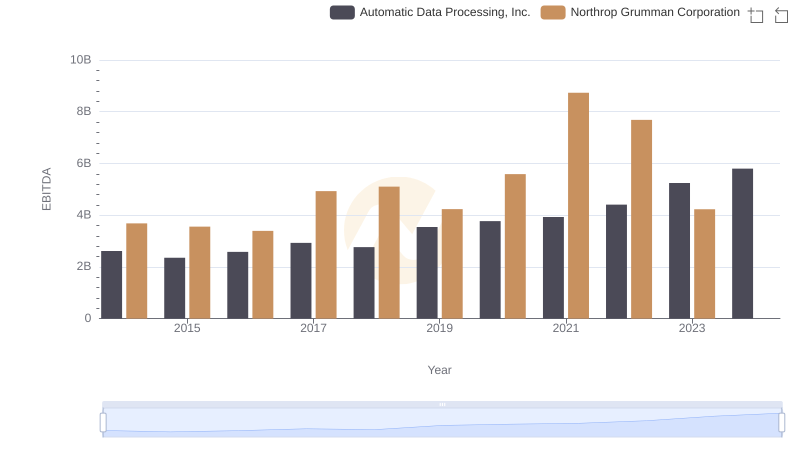
A Professional Review of EBITDA: Automatic Data Processing, Inc. Compared to Northrop Grumman Corporation