| __timestamp | Automatic Data Processing, Inc. | Parker-Hannifin Corporation |
|---|---|---|
| Wednesday, January 1, 2014 | 2616900000 | 1832903000 |
| Thursday, January 1, 2015 | 2355100000 | 1861551000 |
| Friday, January 1, 2016 | 2579500000 | 1558088000 |
| Sunday, January 1, 2017 | 2927200000 | 1846306000 |
| Monday, January 1, 2018 | 2762900000 | 2382235000 |
| Tuesday, January 1, 2019 | 3544500000 | 2513468000 |
| Wednesday, January 1, 2020 | 3769700000 | 2431500000 |
| Friday, January 1, 2021 | 3931600000 | 3092383000 |
| Saturday, January 1, 2022 | 4405500000 | 2441242000 |
| Sunday, January 1, 2023 | 5244600000 | 4071687000 |
| Monday, January 1, 2024 | 5800000000 | 5028229000 |
Cracking the code
In the ever-evolving landscape of corporate finance, EBITDA serves as a crucial indicator of a company's operational performance. Over the past decade, Automatic Data Processing, Inc. (ADP) and Parker-Hannifin Corporation have demonstrated remarkable growth in this metric. From 2014 to 2024, ADP's EBITDA surged by approximately 122%, reflecting its robust business model and strategic initiatives. Meanwhile, Parker-Hannifin Corporation, a leader in motion and control technologies, saw its EBITDA grow by around 174%, showcasing its resilience and adaptability in a competitive market.
The year 2023 marked a significant milestone, with ADP achieving an EBITDA of $5.24 billion, while Parker-Hannifin reached $4.07 billion. By 2024, both companies continued their upward trajectory, with ADP at $5.8 billion and Parker-Hannifin at $5.03 billion. This performance underscores the importance of strategic planning and innovation in driving financial success.
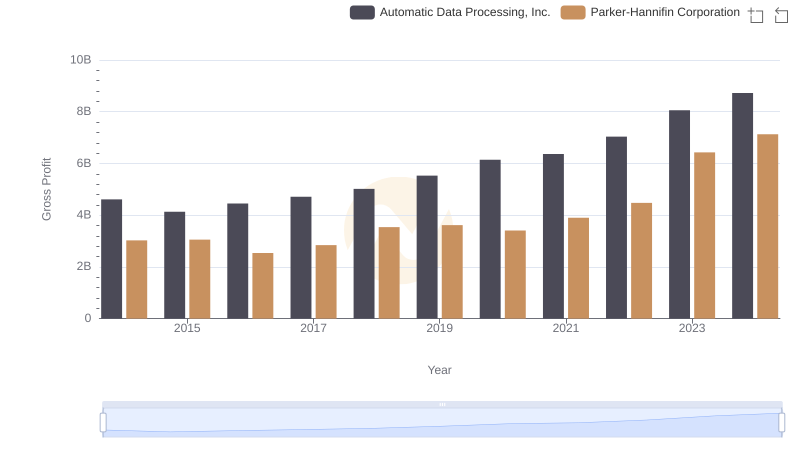
Gross Profit Trends Compared: Automatic Data Processing, Inc. vs Parker-Hannifin Corporation
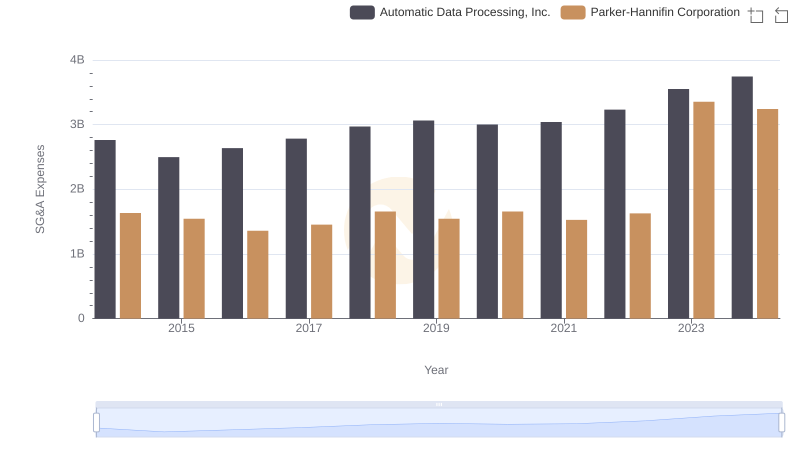
Operational Costs Compared: SG&A Analysis of Automatic Data Processing, Inc. and Parker-Hannifin Corporation
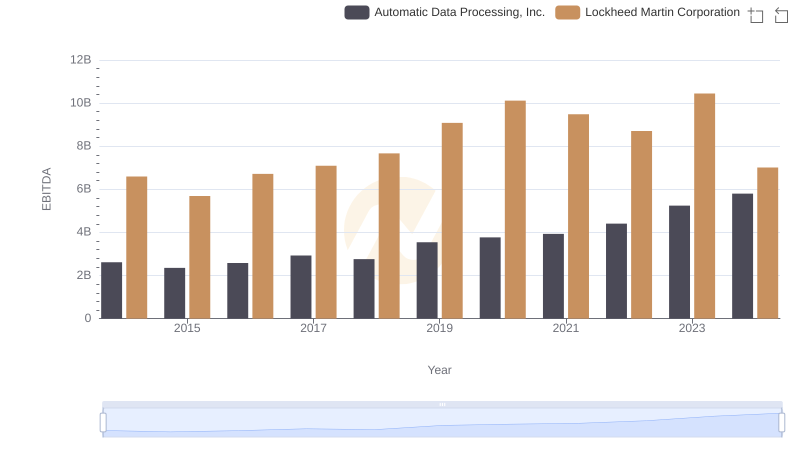
EBITDA Metrics Evaluated: Automatic Data Processing, Inc. vs Lockheed Martin Corporation
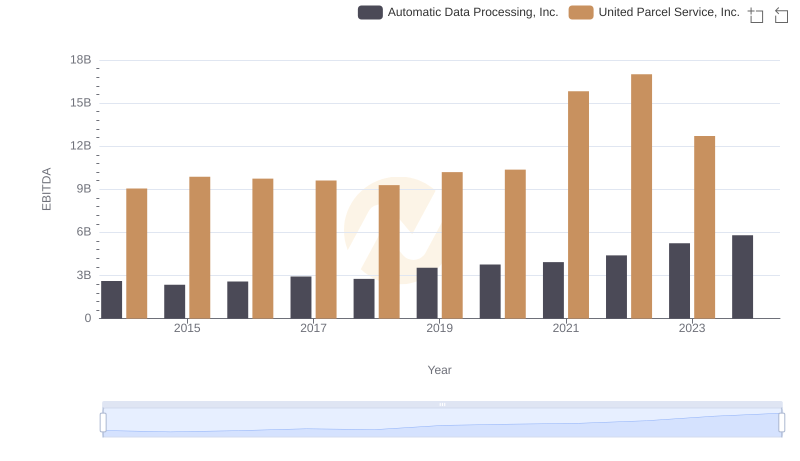
A Side-by-Side Analysis of EBITDA: Automatic Data Processing, Inc. and United Parcel Service, Inc.
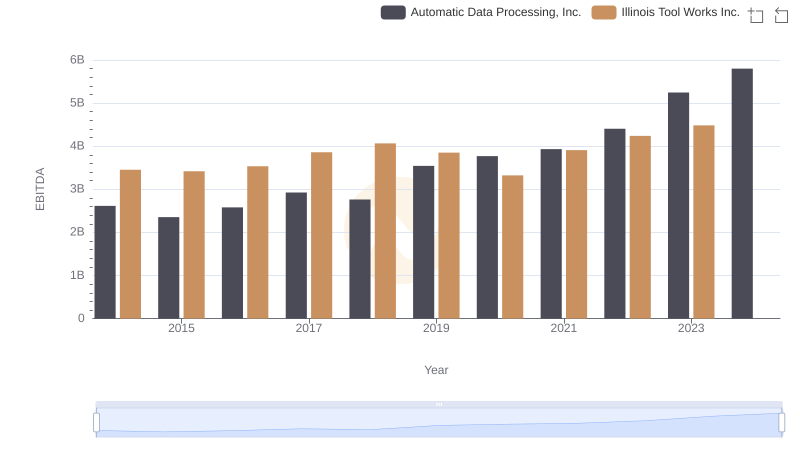
A Professional Review of EBITDA: Automatic Data Processing, Inc. Compared to Illinois Tool Works Inc.
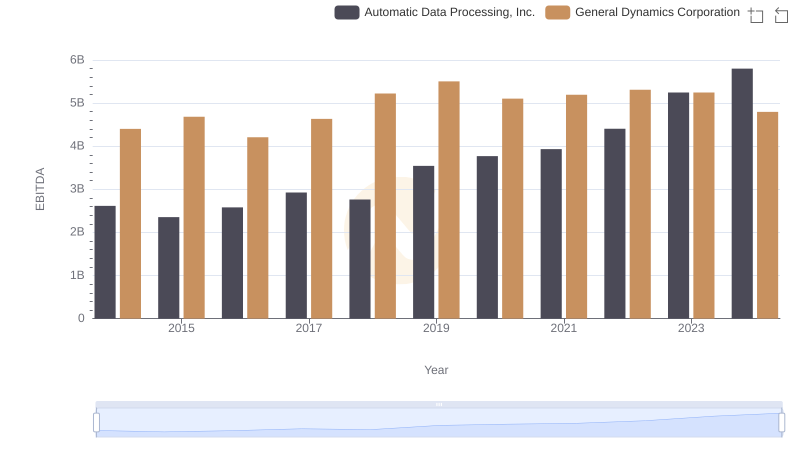
A Professional Review of EBITDA: Automatic Data Processing, Inc. Compared to General Dynamics Corporation
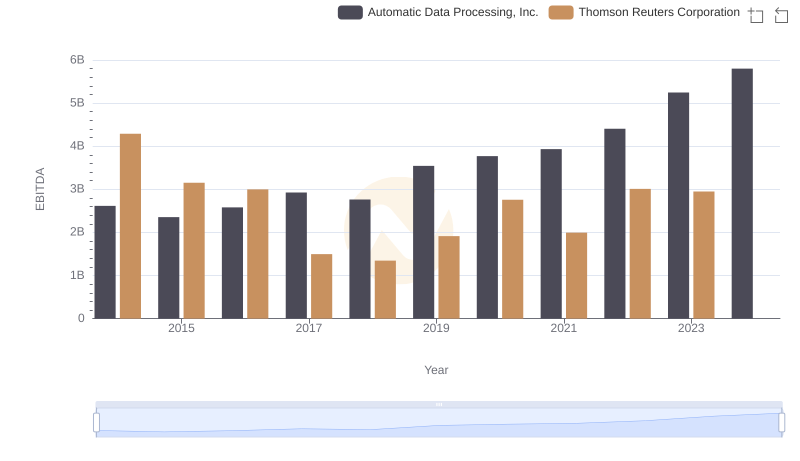
EBITDA Analysis: Evaluating Automatic Data Processing, Inc. Against Thomson Reuters Corporation