| __timestamp | Owens Corning | Watsco, Inc. |
|---|---|---|
| Wednesday, January 1, 2014 | 5276000000 | 3944540000 |
| Thursday, January 1, 2015 | 5350000000 | 4113239000 |
| Friday, January 1, 2016 | 5677000000 | 4220702000 |
| Sunday, January 1, 2017 | 6384000000 | 4341955000 |
| Monday, January 1, 2018 | 7057000000 | 4546653000 |
| Tuesday, January 1, 2019 | 7160000000 | 4770362000 |
| Wednesday, January 1, 2020 | 7055000000 | 5054928000 |
| Friday, January 1, 2021 | 8498000000 | 6280192000 |
| Saturday, January 1, 2022 | 9761000000 | 7274344000 |
| Sunday, January 1, 2023 | 9677000000 | 7283767000 |
| Monday, January 1, 2024 | 7618317000 |
Igniting the spark of knowledge
In the ever-evolving landscape of industrial growth, Watsco, Inc. and Owens Corning stand as titans in their respective fields. Over the past decade, these companies have showcased remarkable revenue trajectories, reflecting broader economic trends and strategic business maneuvers. From 2014 to 2023, Owens Corning's revenue surged by approximately 83%, while Watsco, Inc. experienced a robust growth of around 85%. This period saw Owens Corning's revenue peak in 2022, reaching nearly $9.8 billion, before a slight dip in 2023. Meanwhile, Watsco, Inc. consistently climbed, culminating in a revenue of approximately $7.3 billion in 2023. These figures not only highlight the resilience and adaptability of these companies but also underscore the dynamic nature of the industrial sector. As we look to the future, the strategic decisions made by these industry leaders will undoubtedly shape the next chapter of their growth stories.
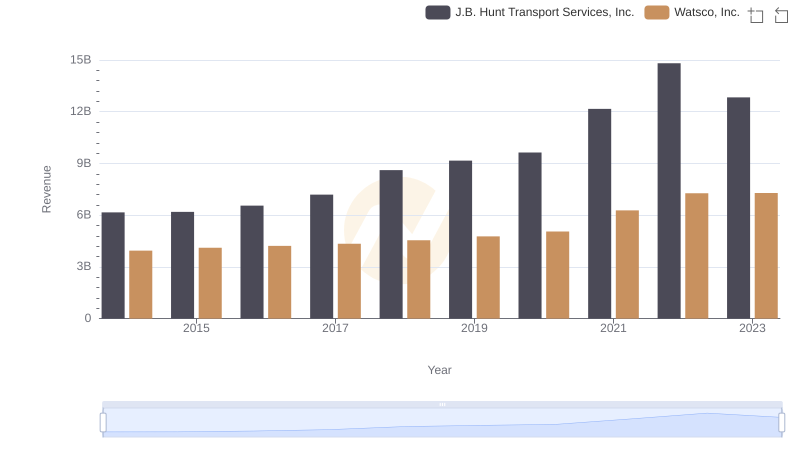
Watsco, Inc. vs J.B. Hunt Transport Services, Inc.: Annual Revenue Growth Compared
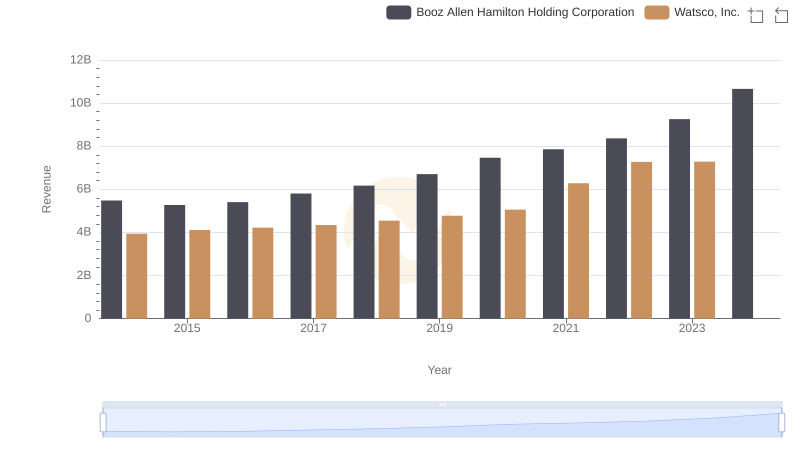
Watsco, Inc. vs Booz Allen Hamilton Holding Corporation: Annual Revenue Growth Compared
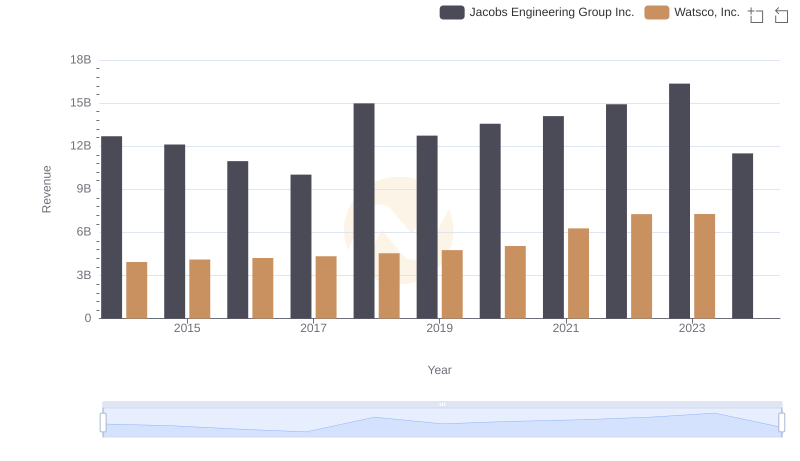
Breaking Down Revenue Trends: Watsco, Inc. vs Jacobs Engineering Group Inc.
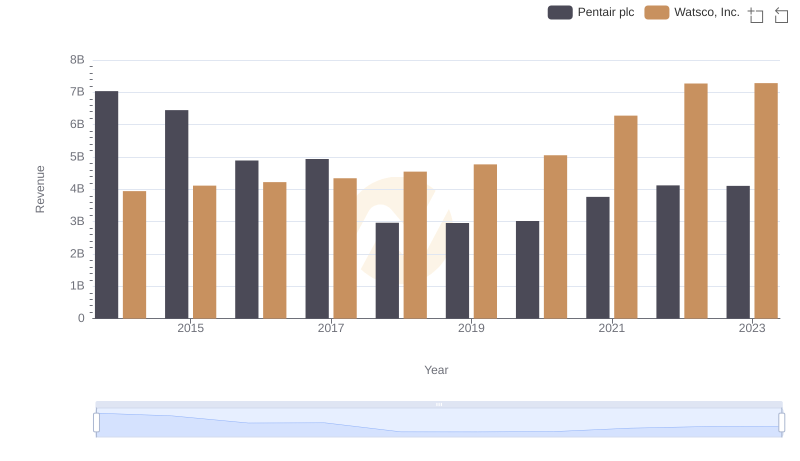
Revenue Insights: Watsco, Inc. and Pentair plc Performance Compared
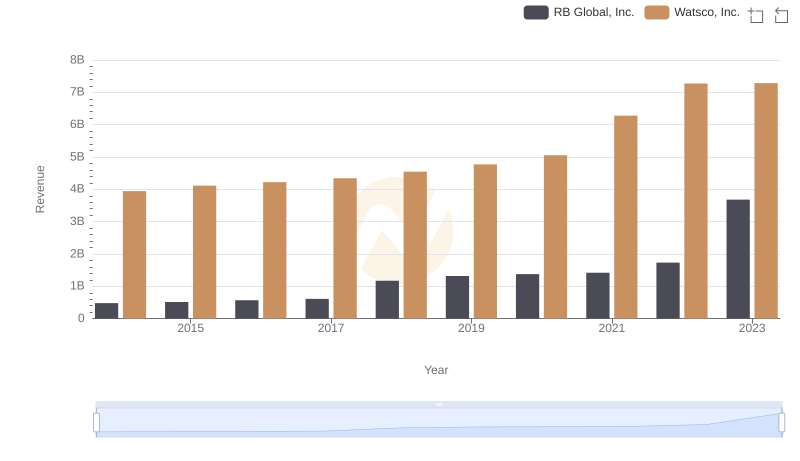
Breaking Down Revenue Trends: Watsco, Inc. vs RB Global, Inc.
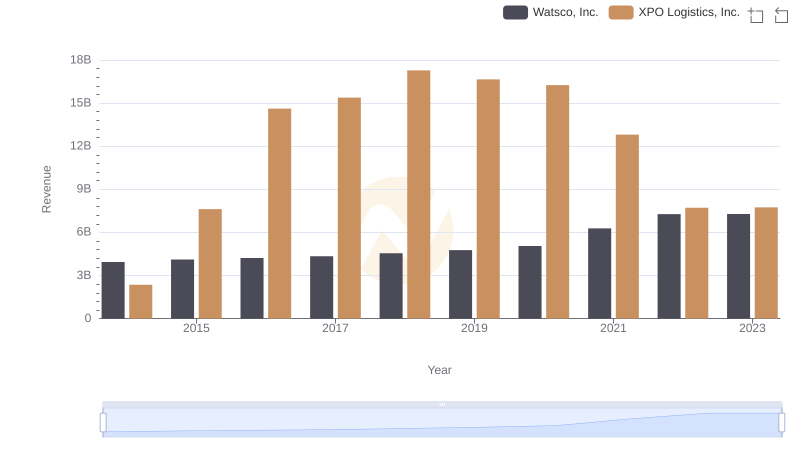
Annual Revenue Comparison: Watsco, Inc. vs XPO Logistics, Inc.
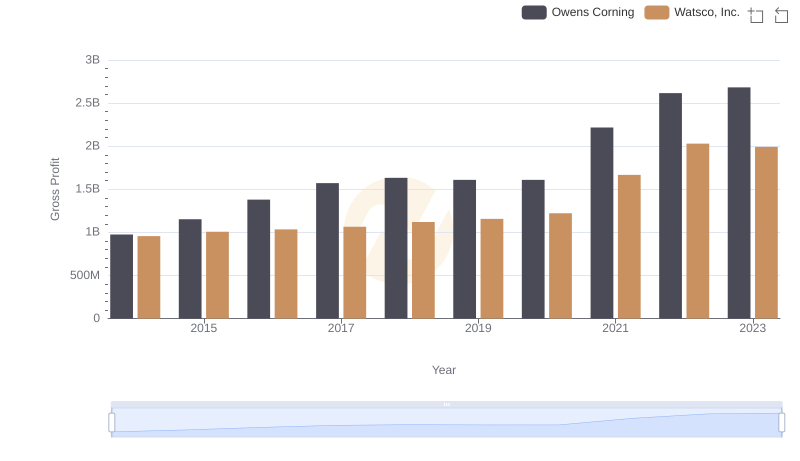
Gross Profit Trends Compared: Watsco, Inc. vs Owens Corning
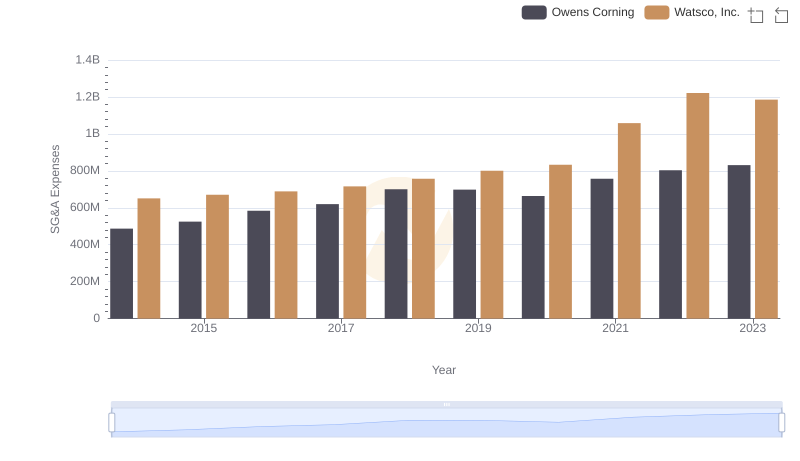
Selling, General, and Administrative Costs: Watsco, Inc. vs Owens Corning
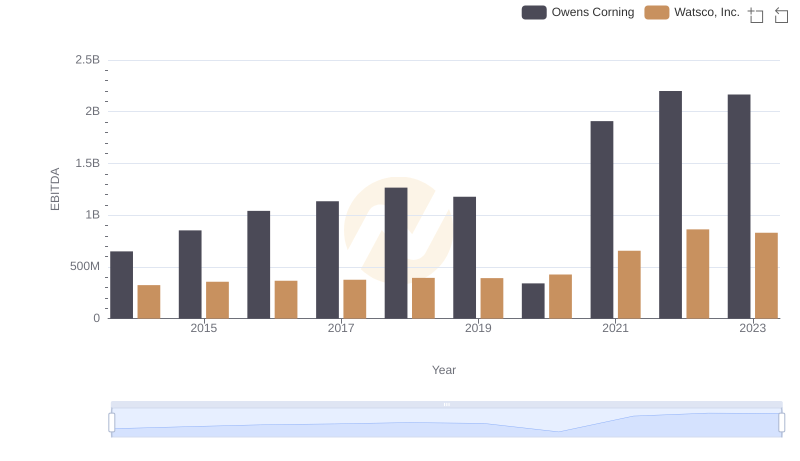
EBITDA Analysis: Evaluating Watsco, Inc. Against Owens Corning