| __timestamp | EMCOR Group, Inc. | Eaton Corporation plc |
|---|---|---|
| Wednesday, January 1, 2014 | 355858000 | 3586000000 |
| Thursday, January 1, 2015 | 362095000 | 3302000000 |
| Friday, January 1, 2016 | 395913000 | 3176000000 |
| Sunday, January 1, 2017 | 478459000 | 3418000000 |
| Monday, January 1, 2018 | 489954000 | 3875000000 |
| Tuesday, January 1, 2019 | 556055000 | 2827000000 |
| Wednesday, January 1, 2020 | 601449000 | 1674000000 |
| Friday, January 1, 2021 | 646861000 | 2423000000 |
| Saturday, January 1, 2022 | 682399000 | 3031000000 |
| Sunday, January 1, 2023 | 1009017000 | 4904000000 |
| Monday, January 1, 2024 | 5547999771 |
Cracking the code
In the ever-evolving landscape of industrial giants, Eaton Corporation plc and EMCOR Group, Inc. have showcased remarkable EBITDA performance over the past decade. From 2014 to 2023, Eaton's EBITDA surged by approximately 37%, peaking in 2023 with a staggering $4.9 billion. Meanwhile, EMCOR demonstrated a robust growth trajectory, with its EBITDA nearly tripling, reaching over $1 billion in the same year.
This data not only reflects the financial health of these corporations but also offers a glimpse into the broader industrial trends. As we look to the future, these companies remain pivotal players in shaping the industry's landscape.
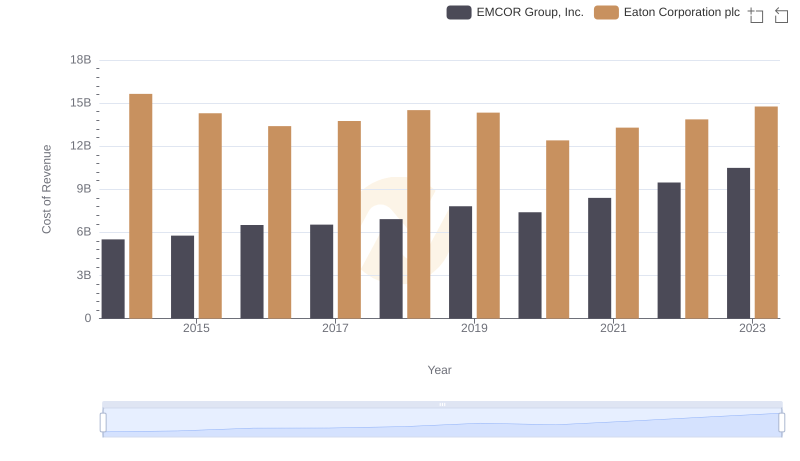
Cost of Revenue: Key Insights for Eaton Corporation plc and EMCOR Group, Inc.
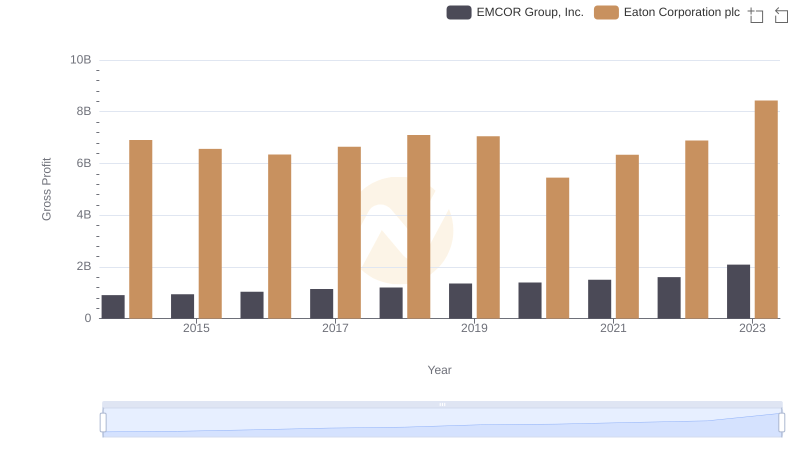
Eaton Corporation plc vs EMCOR Group, Inc.: A Gross Profit Performance Breakdown
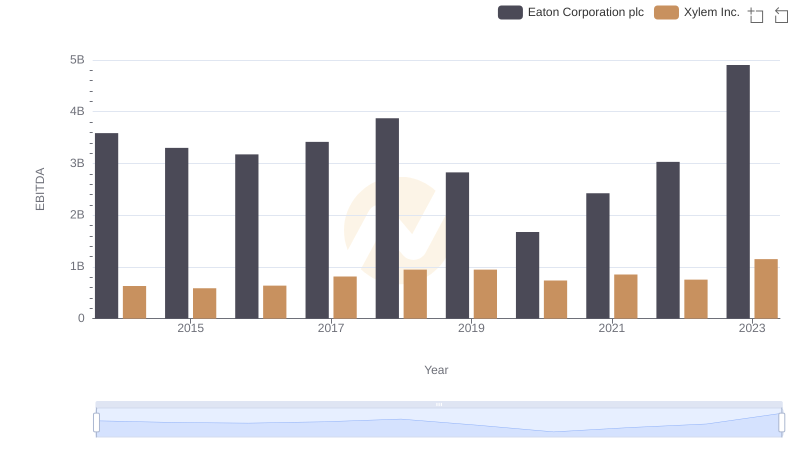
Comparative EBITDA Analysis: Eaton Corporation plc vs Xylem Inc.
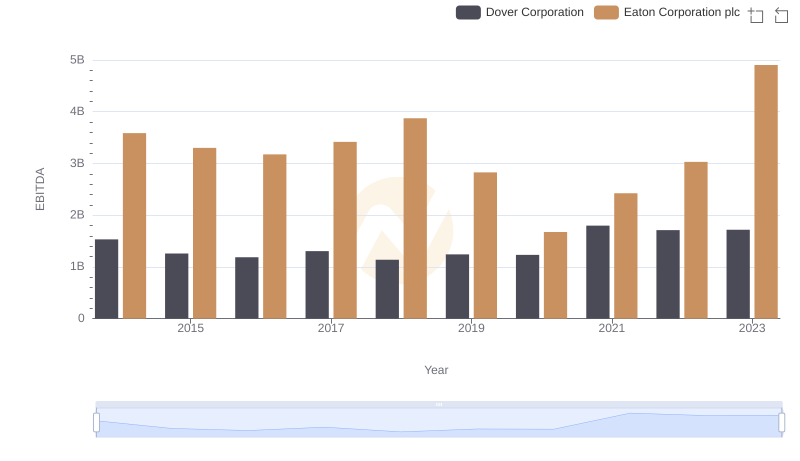
Comparative EBITDA Analysis: Eaton Corporation plc vs Dover Corporation
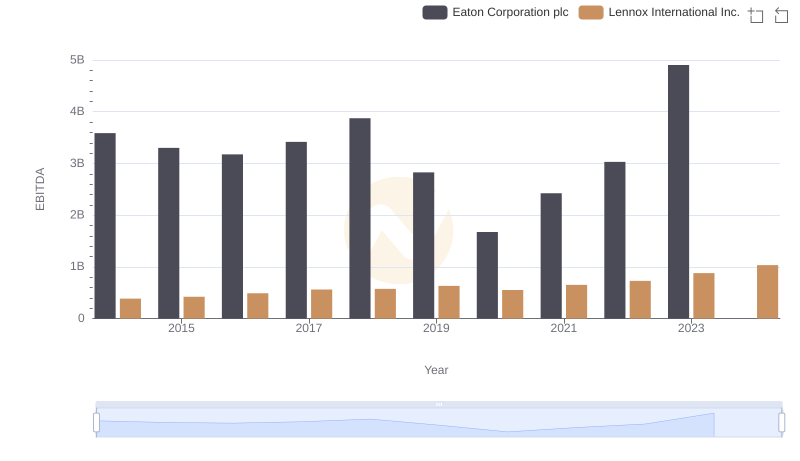
Eaton Corporation plc vs Lennox International Inc.: In-Depth EBITDA Performance Comparison