| __timestamp | EMCOR Group, Inc. | Westinghouse Air Brake Technologies Corporation |
|---|---|---|
| Wednesday, January 1, 2014 | 5517719000 | 2130920000 |
| Thursday, January 1, 2015 | 5774247000 | 2281845000 |
| Friday, January 1, 2016 | 6513662000 | 2029647000 |
| Sunday, January 1, 2017 | 6539987000 | 2841159000 |
| Monday, January 1, 2018 | 6925178000 | 3151816000 |
| Tuesday, January 1, 2019 | 7818743000 | 6122400000 |
| Wednesday, January 1, 2020 | 7401679000 | 5657400000 |
| Friday, January 1, 2021 | 8401843000 | 5687000000 |
| Saturday, January 1, 2022 | 9472526000 | 6070000000 |
| Sunday, January 1, 2023 | 10493534000 | 6733000000 |
| Monday, January 1, 2024 | 7021000000 |
Igniting the spark of knowledge
In the ever-evolving landscape of industrial services, understanding cost dynamics is crucial. Over the past decade, EMCOR Group, Inc. and Westinghouse Air Brake Technologies Corporation have showcased distinct trends in their cost of revenue. From 2014 to 2023, EMCOR Group, Inc. experienced a robust growth of approximately 90%, reflecting its strategic expansion and operational efficiency. In contrast, Westinghouse Air Brake Technologies Corporation saw a significant increase of around 215% during the same period, indicating a more aggressive growth trajectory.
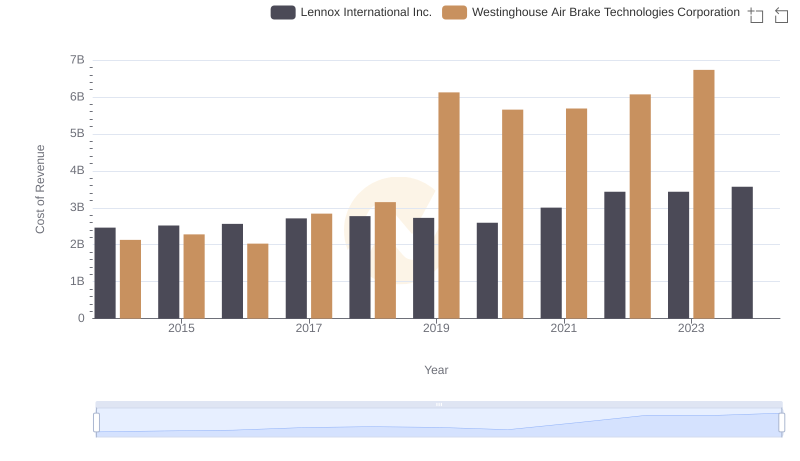
Westinghouse Air Brake Technologies Corporation vs Lennox International Inc.: Efficiency in Cost of Revenue Explored
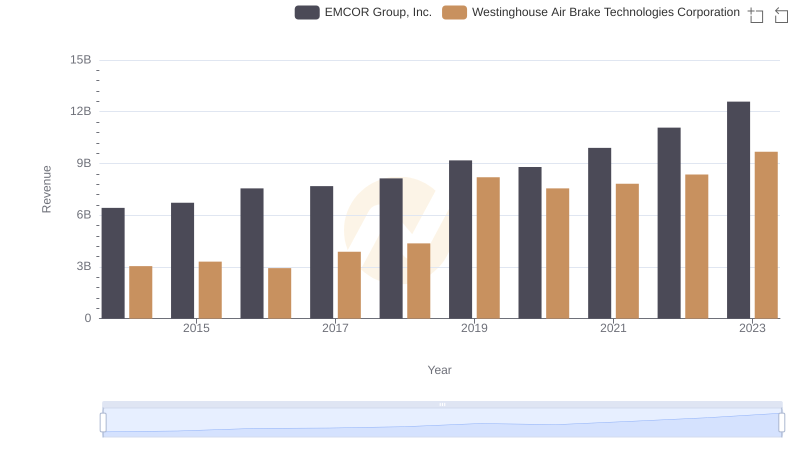
Westinghouse Air Brake Technologies Corporation and EMCOR Group, Inc.: A Comprehensive Revenue Analysis
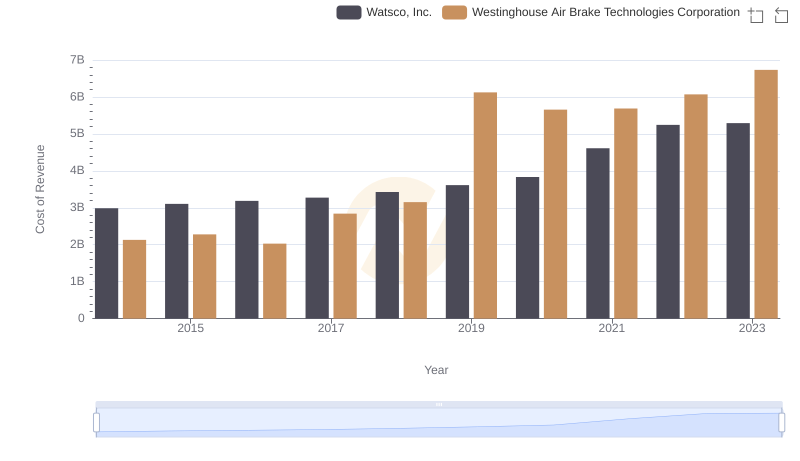
Cost of Revenue: Key Insights for Westinghouse Air Brake Technologies Corporation and Watsco, Inc.
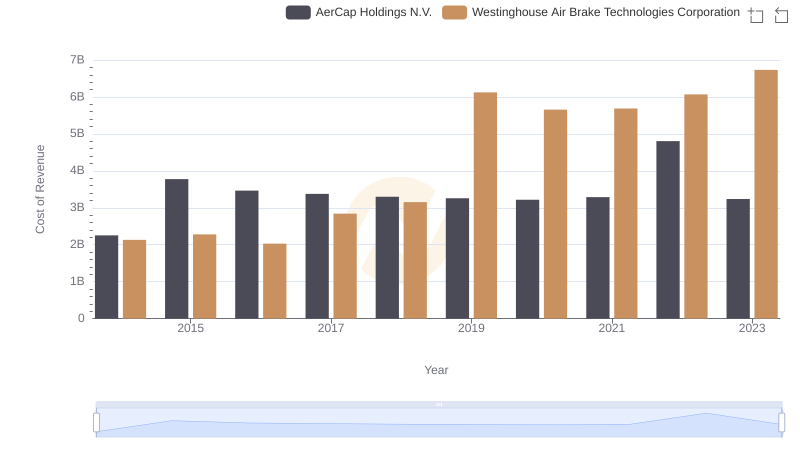
Analyzing Cost of Revenue: Westinghouse Air Brake Technologies Corporation and AerCap Holdings N.V.

Cost Insights: Breaking Down Westinghouse Air Brake Technologies Corporation and TransUnion's Expenses
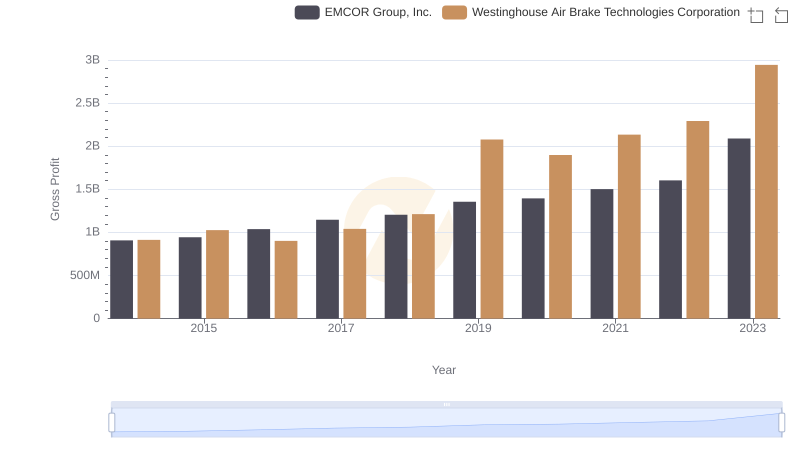
Who Generates Higher Gross Profit? Westinghouse Air Brake Technologies Corporation or EMCOR Group, Inc.
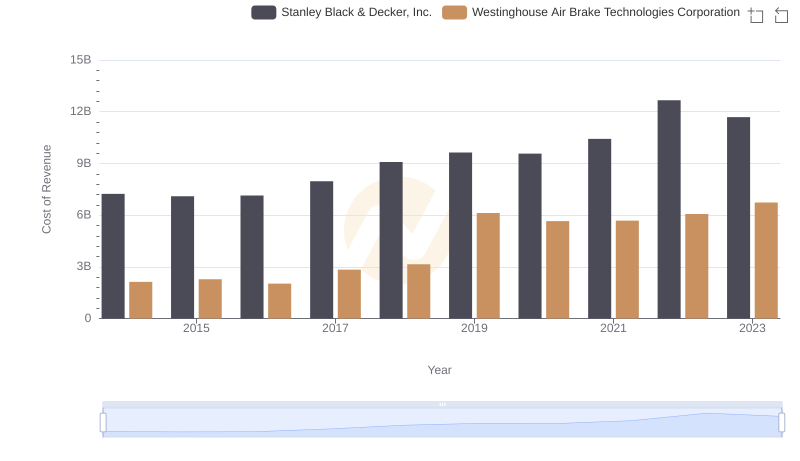
Cost of Revenue Trends: Westinghouse Air Brake Technologies Corporation vs Stanley Black & Decker, Inc.
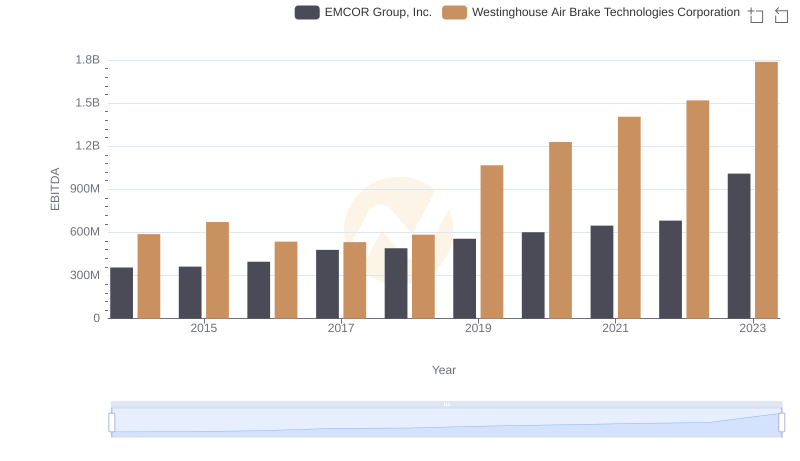
Professional EBITDA Benchmarking: Westinghouse Air Brake Technologies Corporation vs EMCOR Group, Inc.