| __timestamp | Watsco, Inc. | Westinghouse Air Brake Technologies Corporation |
|---|---|---|
| Wednesday, January 1, 2014 | 2988138000 | 2130920000 |
| Thursday, January 1, 2015 | 3105882000 | 2281845000 |
| Friday, January 1, 2016 | 3186118000 | 2029647000 |
| Sunday, January 1, 2017 | 3276296000 | 2841159000 |
| Monday, January 1, 2018 | 3426401000 | 3151816000 |
| Tuesday, January 1, 2019 | 3613406000 | 6122400000 |
| Wednesday, January 1, 2020 | 3832107000 | 5657400000 |
| Friday, January 1, 2021 | 4612647000 | 5687000000 |
| Saturday, January 1, 2022 | 5244055000 | 6070000000 |
| Sunday, January 1, 2023 | 5291627000 | 6733000000 |
| Monday, January 1, 2024 | 5573604000 | 7021000000 |
Unleashing insights
In the ever-evolving landscape of industrial and HVAC sectors, understanding cost dynamics is crucial. From 2014 to 2023, Westinghouse Air Brake Technologies Corporation and Watsco, Inc. have shown distinct trends in their cost of revenue. Westinghouse Air Brake Technologies Corporation experienced a significant increase of approximately 216% over this period, peaking in 2023. Meanwhile, Watsco, Inc. saw a steady rise of about 77%, with its highest cost of revenue also recorded in 2023. Notably, 2019 marked a pivotal year for Westinghouse, with a dramatic 94% surge compared to the previous year, reflecting strategic shifts or market conditions. These insights highlight the importance of cost management and strategic planning in maintaining competitive advantage. As industries continue to adapt, monitoring such financial metrics will be key to understanding broader economic trends.
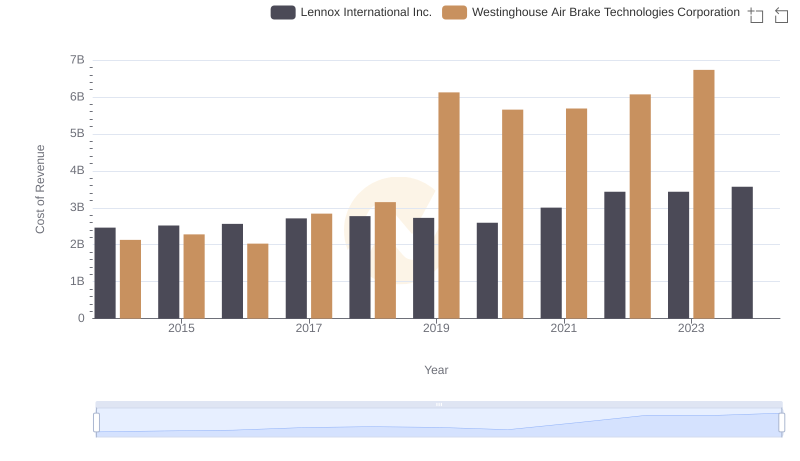
Westinghouse Air Brake Technologies Corporation vs Lennox International Inc.: Efficiency in Cost of Revenue Explored
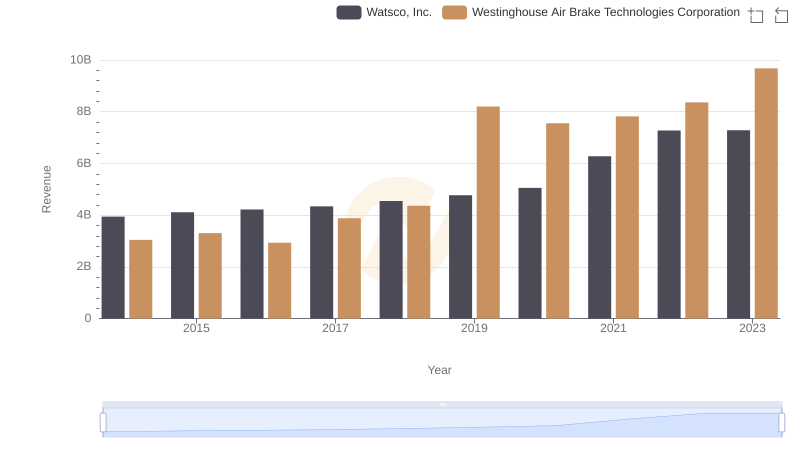
Revenue Insights: Westinghouse Air Brake Technologies Corporation and Watsco, Inc. Performance Compared
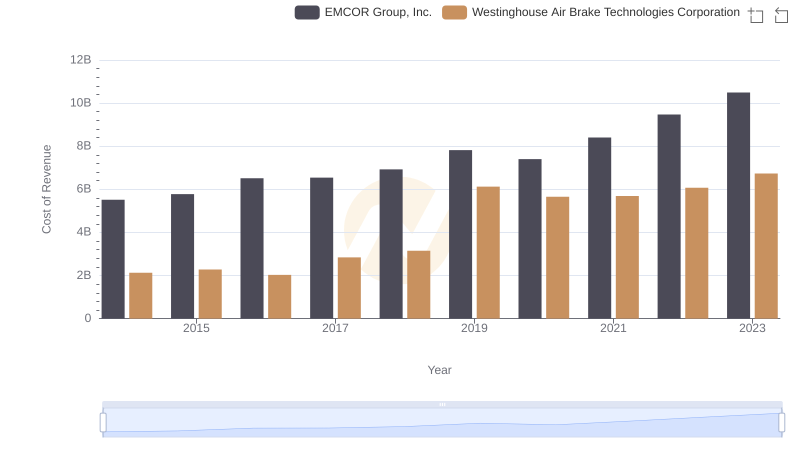
Cost of Revenue Trends: Westinghouse Air Brake Technologies Corporation vs EMCOR Group, Inc.
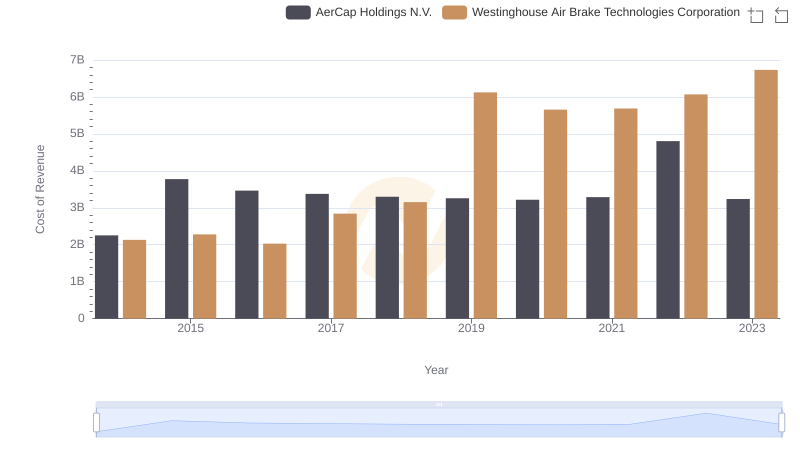
Analyzing Cost of Revenue: Westinghouse Air Brake Technologies Corporation and AerCap Holdings N.V.

Cost Insights: Breaking Down Westinghouse Air Brake Technologies Corporation and TransUnion's Expenses
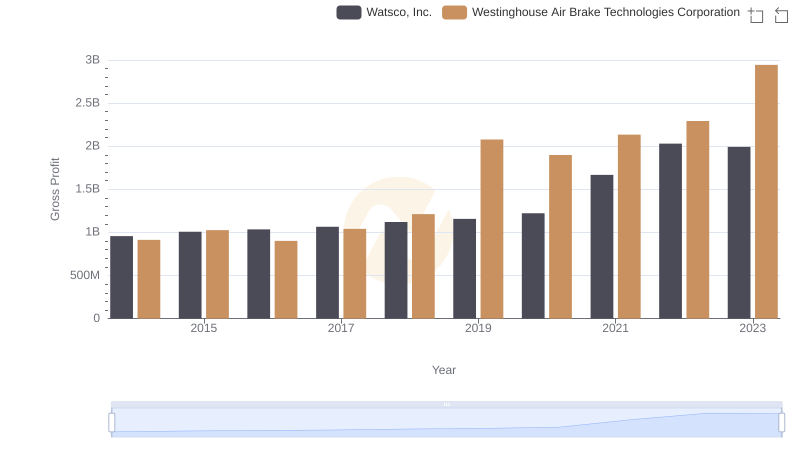
Gross Profit Trends Compared: Westinghouse Air Brake Technologies Corporation vs Watsco, Inc.
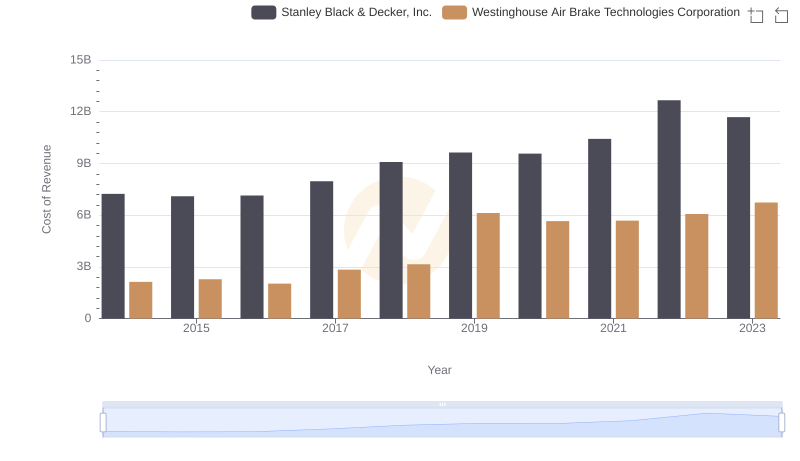
Cost of Revenue Trends: Westinghouse Air Brake Technologies Corporation vs Stanley Black & Decker, Inc.
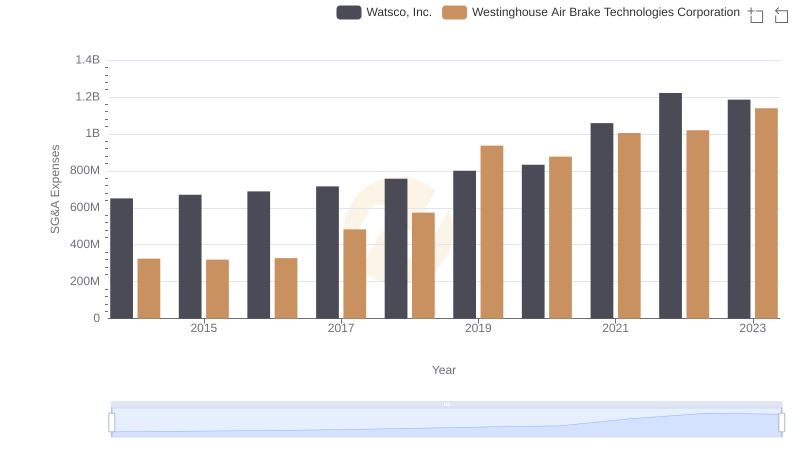
SG&A Efficiency Analysis: Comparing Westinghouse Air Brake Technologies Corporation and Watsco, Inc.