| __timestamp | AerCap Holdings N.V. | Westinghouse Air Brake Technologies Corporation |
|---|---|---|
| Wednesday, January 1, 2014 | 2252878000 | 2130920000 |
| Thursday, January 1, 2015 | 3776407000 | 2281845000 |
| Friday, January 1, 2016 | 3465727000 | 2029647000 |
| Sunday, January 1, 2017 | 3377439000 | 2841159000 |
| Monday, January 1, 2018 | 3299635000 | 3151816000 |
| Tuesday, January 1, 2019 | 3259091000 | 6122400000 |
| Wednesday, January 1, 2020 | 3217133000 | 5657400000 |
| Friday, January 1, 2021 | 3287413000 | 5687000000 |
| Saturday, January 1, 2022 | 4805277000 | 6070000000 |
| Sunday, January 1, 2023 | 3237016000 | 6733000000 |
| Monday, January 1, 2024 | 7021000000 |
Unleashing the power of data
In the ever-evolving landscape of global industries, understanding the cost of revenue is crucial for evaluating a company's financial health. Over the past decade, Westinghouse Air Brake Technologies Corporation and AerCap Holdings N.V. have showcased intriguing trends in their cost of revenue.
From 2014 to 2023, Westinghouse Air Brake Technologies Corporation experienced a significant increase in its cost of revenue, peaking in 2023 with a 216% rise from its 2014 figures. This growth reflects the company's expanding operations and market reach.
Conversely, AerCap Holdings N.V. displayed a more stable trajectory, with a notable spike in 2022, marking a 113% increase from 2014. This surge aligns with strategic acquisitions and fleet expansions.
These insights underscore the dynamic nature of cost management in the transportation and leasing sectors, offering valuable lessons for investors and industry analysts alike.
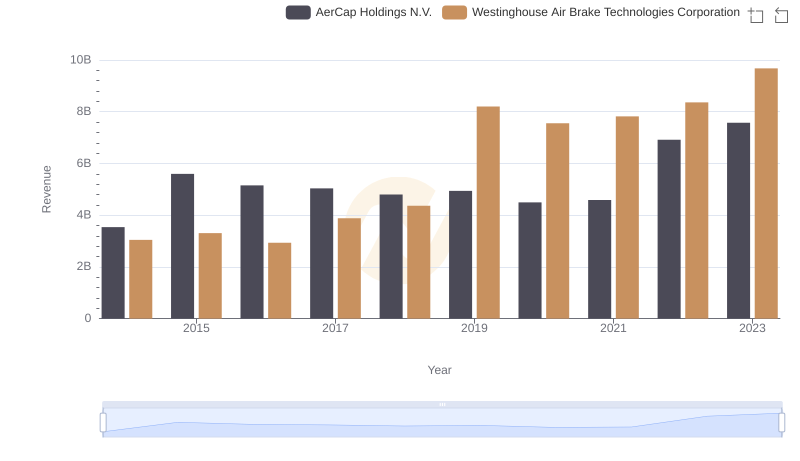
Breaking Down Revenue Trends: Westinghouse Air Brake Technologies Corporation vs AerCap Holdings N.V.
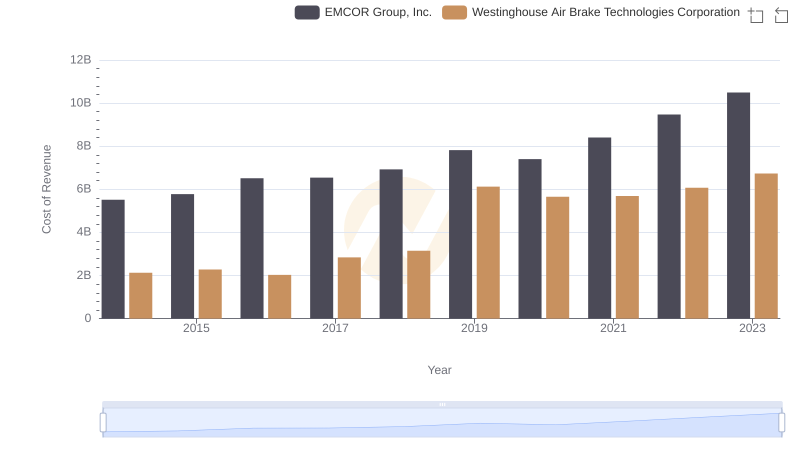
Cost of Revenue Trends: Westinghouse Air Brake Technologies Corporation vs EMCOR Group, Inc.
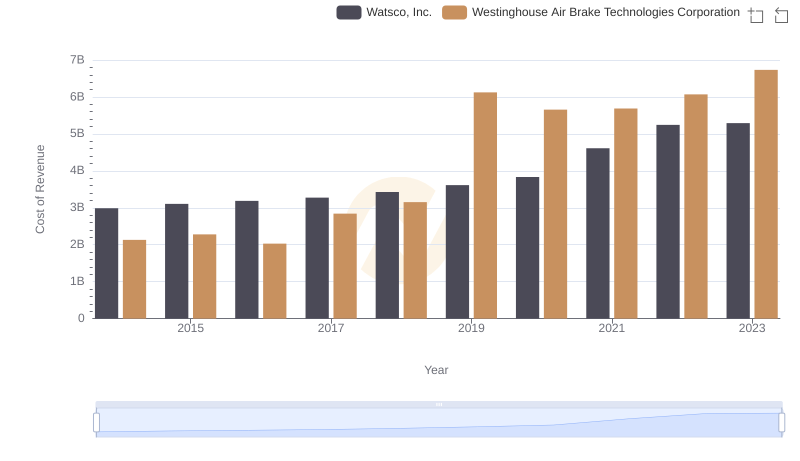
Cost of Revenue: Key Insights for Westinghouse Air Brake Technologies Corporation and Watsco, Inc.

Cost Insights: Breaking Down Westinghouse Air Brake Technologies Corporation and TransUnion's Expenses
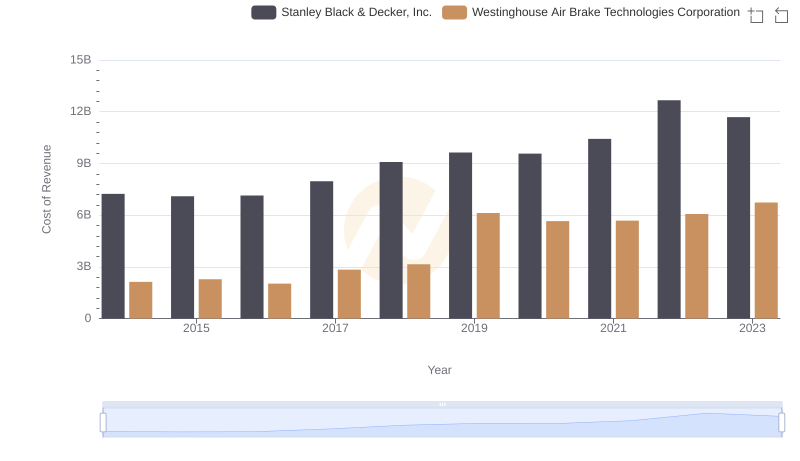
Cost of Revenue Trends: Westinghouse Air Brake Technologies Corporation vs Stanley Black & Decker, Inc.
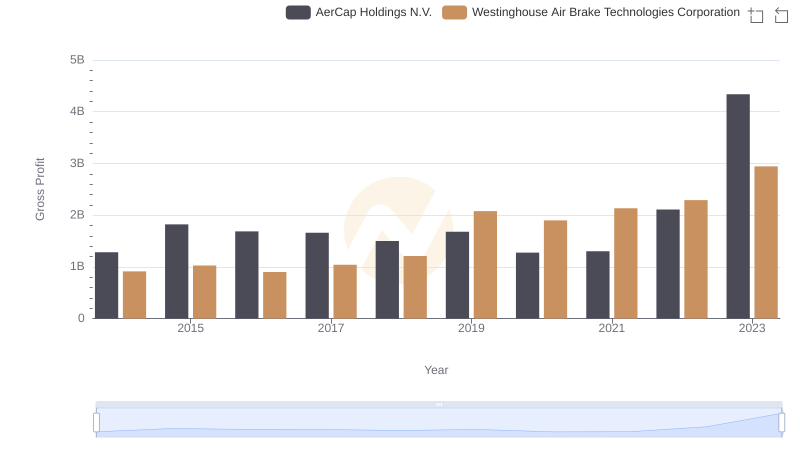
Westinghouse Air Brake Technologies Corporation vs AerCap Holdings N.V.: A Gross Profit Performance Breakdown
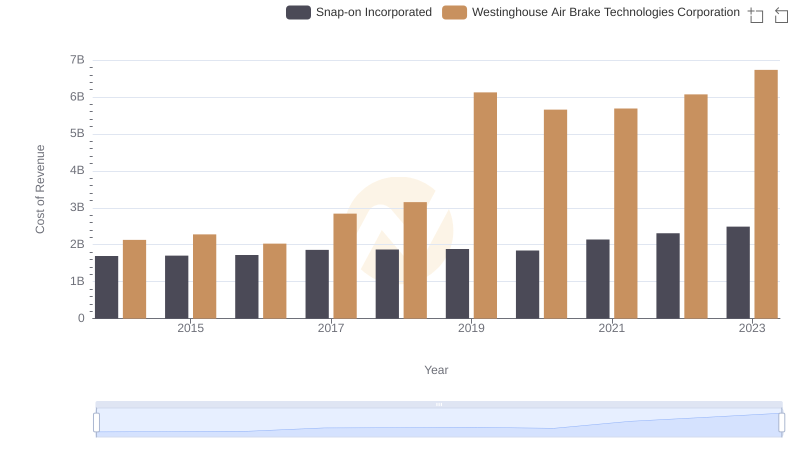
Cost of Revenue Trends: Westinghouse Air Brake Technologies Corporation vs Snap-on Incorporated
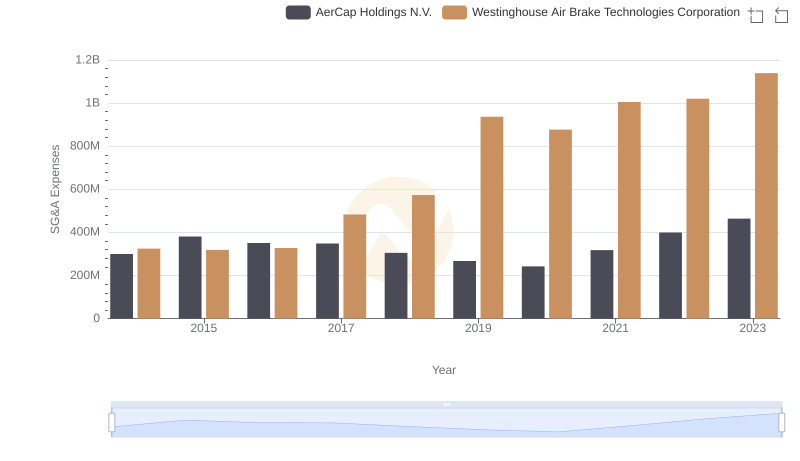
Selling, General, and Administrative Costs: Westinghouse Air Brake Technologies Corporation vs AerCap Holdings N.V.