| __timestamp | TransUnion | Westinghouse Air Brake Technologies Corporation |
|---|---|---|
| Wednesday, January 1, 2014 | 499100000 | 2130920000 |
| Thursday, January 1, 2015 | 531600000 | 2281845000 |
| Friday, January 1, 2016 | 579100000 | 2029647000 |
| Sunday, January 1, 2017 | 645700000 | 2841159000 |
| Monday, January 1, 2018 | 790100000 | 3151816000 |
| Tuesday, January 1, 2019 | 874100000 | 6122400000 |
| Wednesday, January 1, 2020 | 920400000 | 5657400000 |
| Friday, January 1, 2021 | 991600000 | 5687000000 |
| Saturday, January 1, 2022 | 1222900000 | 6070000000 |
| Sunday, January 1, 2023 | 1517300000 | 6733000000 |
| Monday, January 1, 2024 | 0 | 7021000000 |
Data in motion
In the ever-evolving landscape of corporate finance, understanding cost structures is pivotal. Over the past decade, Westinghouse Air Brake Technologies Corporation and TransUnion have showcased distinct financial trajectories. From 2014 to 2023, Westinghouse's cost of revenue surged by approximately 216%, peaking at $6.73 billion in 2023. This reflects their aggressive expansion and operational scaling. In contrast, TransUnion's expenses grew by about 204%, reaching $1.52 billion in the same year, indicating a steady yet robust growth strategy.
These trends highlight the differing strategic priorities of these corporations. Westinghouse's larger cost base suggests a focus on broadening its market footprint, while TransUnion's more measured increase points to a focus on efficiency and sustainable growth. As investors and analysts, understanding these nuances can provide deeper insights into potential future performance and strategic direction.
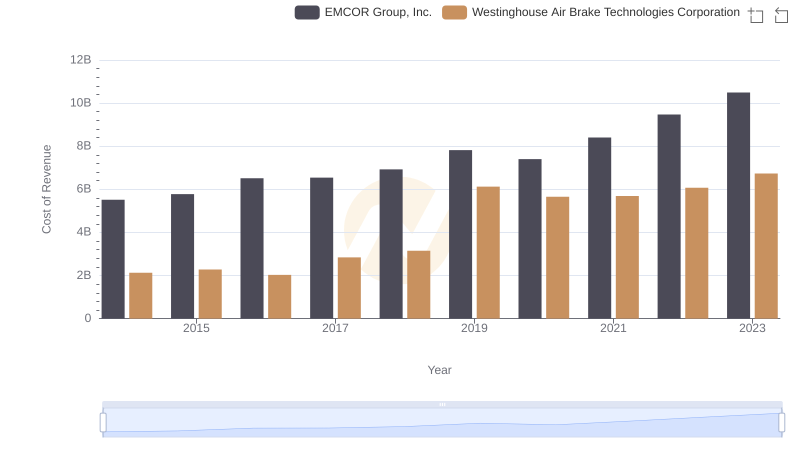
Cost of Revenue Trends: Westinghouse Air Brake Technologies Corporation vs EMCOR Group, Inc.
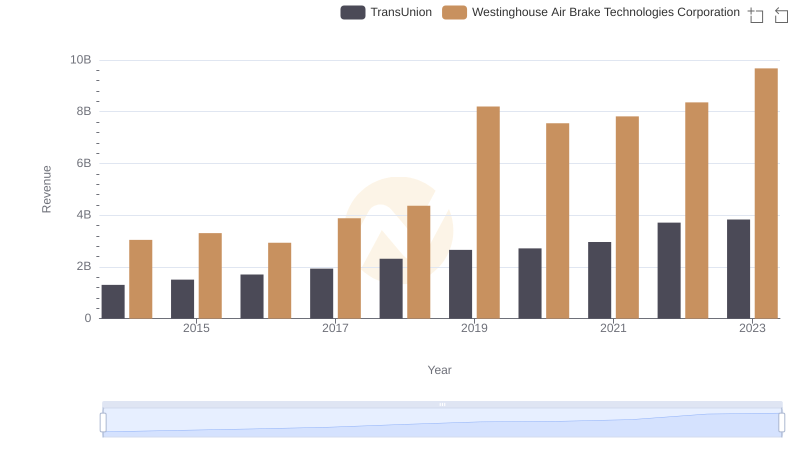
Annual Revenue Comparison: Westinghouse Air Brake Technologies Corporation vs TransUnion
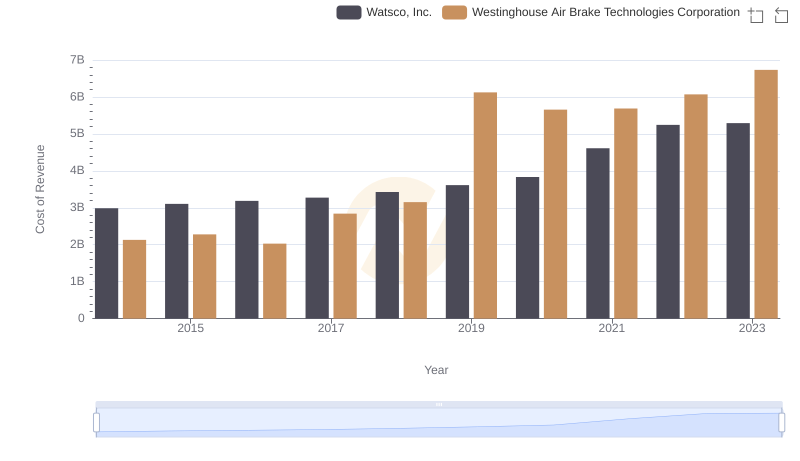
Cost of Revenue: Key Insights for Westinghouse Air Brake Technologies Corporation and Watsco, Inc.
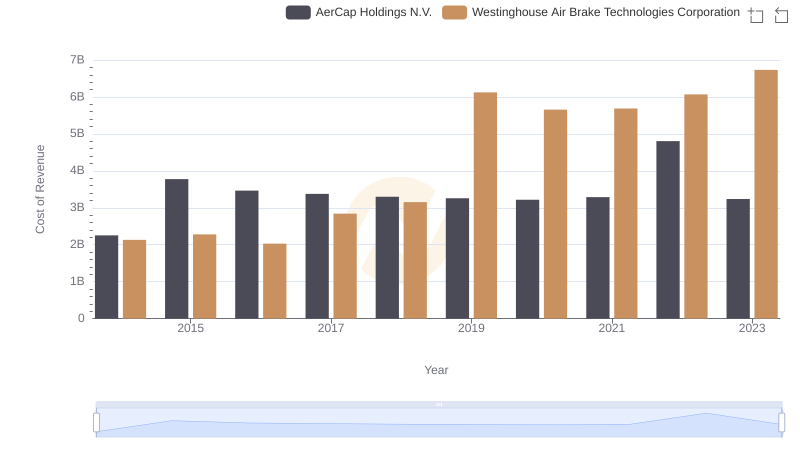
Analyzing Cost of Revenue: Westinghouse Air Brake Technologies Corporation and AerCap Holdings N.V.
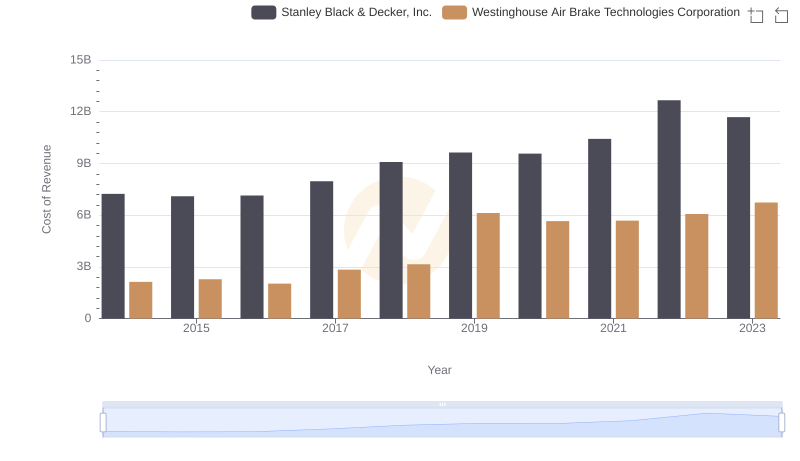
Cost of Revenue Trends: Westinghouse Air Brake Technologies Corporation vs Stanley Black & Decker, Inc.
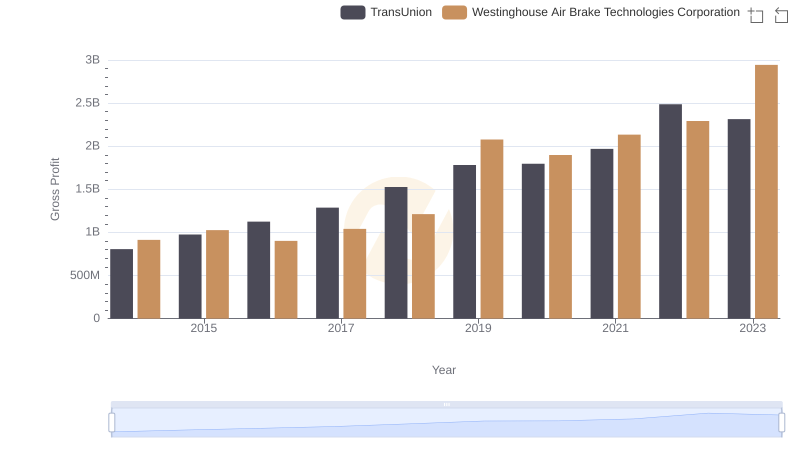
Gross Profit Trends Compared: Westinghouse Air Brake Technologies Corporation vs TransUnion
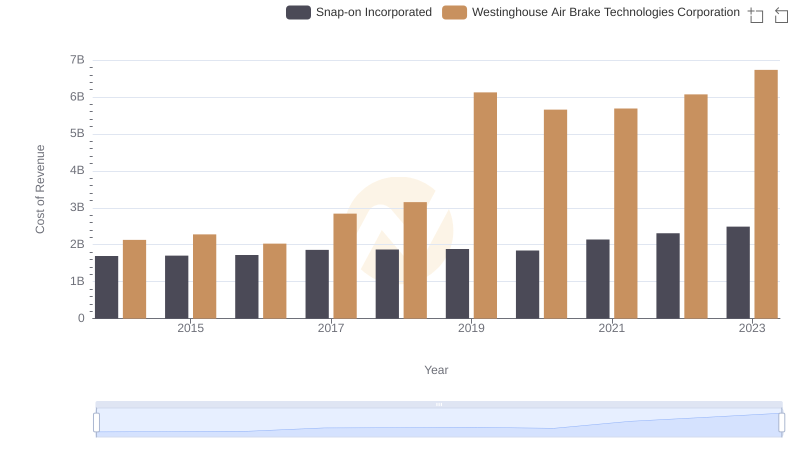
Cost of Revenue Trends: Westinghouse Air Brake Technologies Corporation vs Snap-on Incorporated