| __timestamp | Avery Dennison Corporation | Westinghouse Air Brake Technologies Corporation |
|---|---|---|
| Wednesday, January 1, 2014 | 4679100000 | 2130920000 |
| Thursday, January 1, 2015 | 4321100000 | 2281845000 |
| Friday, January 1, 2016 | 4386800000 | 2029647000 |
| Sunday, January 1, 2017 | 4801600000 | 2841159000 |
| Monday, January 1, 2018 | 5243500000 | 3151816000 |
| Tuesday, January 1, 2019 | 5166000000 | 6122400000 |
| Wednesday, January 1, 2020 | 5048200000 | 5657400000 |
| Friday, January 1, 2021 | 6095500000 | 5687000000 |
| Saturday, January 1, 2022 | 6635100000 | 6070000000 |
| Sunday, January 1, 2023 | 6086800000 | 6733000000 |
| Monday, January 1, 2024 | 6225000000 | 7021000000 |
Unveiling the hidden dimensions of data
In the ever-evolving landscape of industrial and manufacturing sectors, understanding cost dynamics is crucial. This analysis delves into the cost of revenue trends for two industry giants: Westinghouse Air Brake Technologies Corporation and Avery Dennison Corporation, from 2014 to 2023.
Avery Dennison Corporation, a leader in labeling and packaging materials, has seen a steady increase in its cost of revenue, peaking in 2022 with a 53% rise from 2014. Meanwhile, Westinghouse Air Brake Technologies Corporation, a pivotal player in rail technology, experienced a significant surge, with costs more than tripling by 2023 compared to 2014.
These trends highlight the differing cost structures and growth trajectories of these corporations. Avery Dennison's consistent growth contrasts with Westinghouse's more volatile pattern, reflecting broader industry shifts and strategic decisions. Understanding these patterns is essential for stakeholders and investors aiming to navigate the complexities of these sectors.
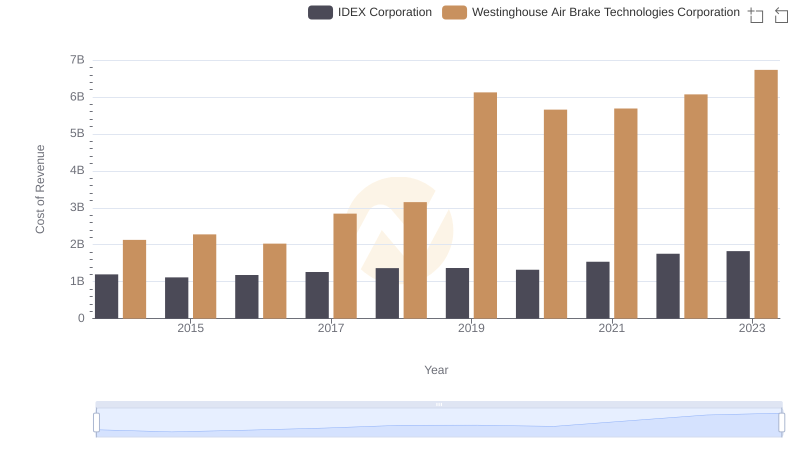
Comparing Cost of Revenue Efficiency: Westinghouse Air Brake Technologies Corporation vs IDEX Corporation
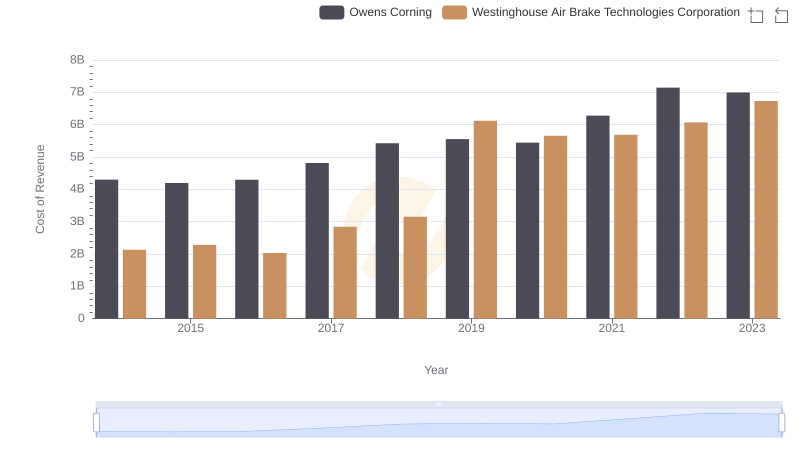
Westinghouse Air Brake Technologies Corporation vs Owens Corning: Efficiency in Cost of Revenue Explored
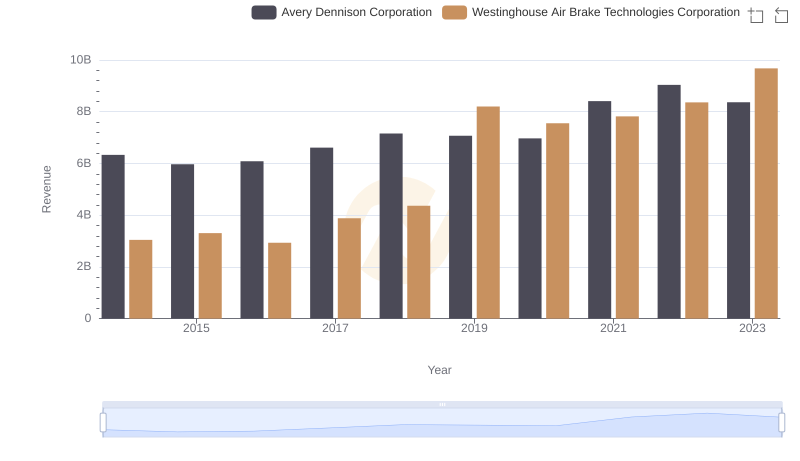
Annual Revenue Comparison: Westinghouse Air Brake Technologies Corporation vs Avery Dennison Corporation
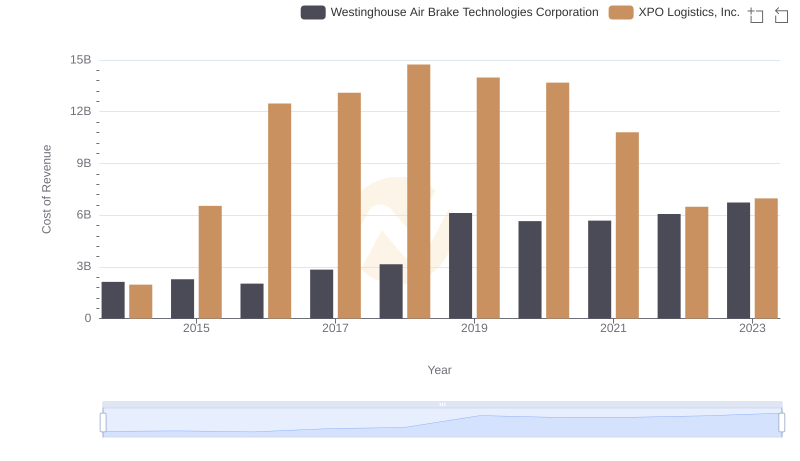
Cost of Revenue Trends: Westinghouse Air Brake Technologies Corporation vs XPO Logistics, Inc.
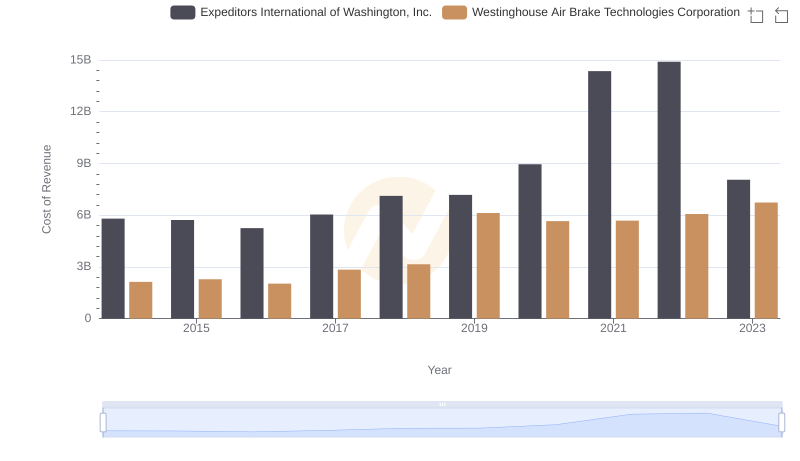
Cost of Revenue Trends: Westinghouse Air Brake Technologies Corporation vs Expeditors International of Washington, Inc.
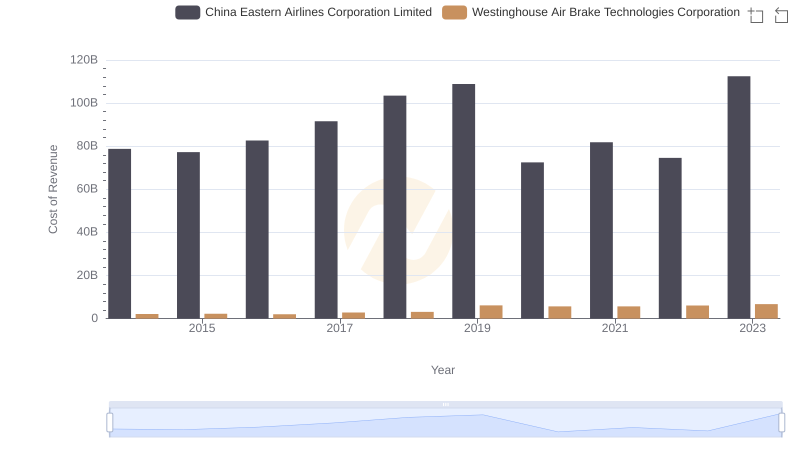
Cost of Revenue Trends: Westinghouse Air Brake Technologies Corporation vs China Eastern Airlines Corporation Limited
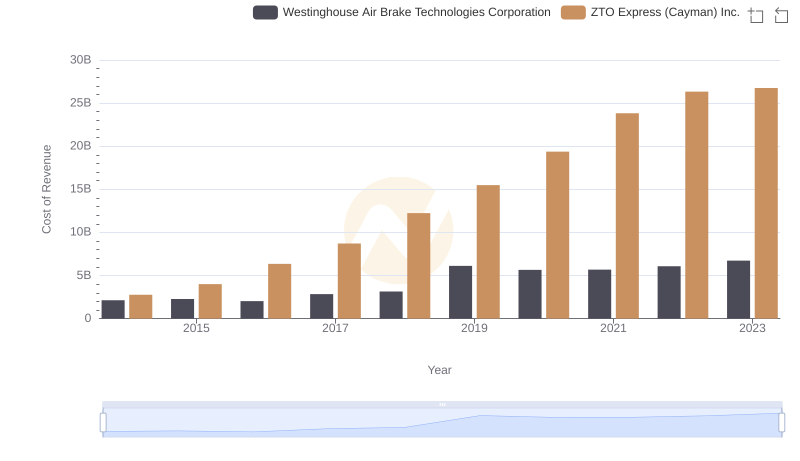
Cost of Revenue Trends: Westinghouse Air Brake Technologies Corporation vs ZTO Express (Cayman) Inc.
Gross Profit Trends Compared: Westinghouse Air Brake Technologies Corporation vs Avery Dennison Corporation
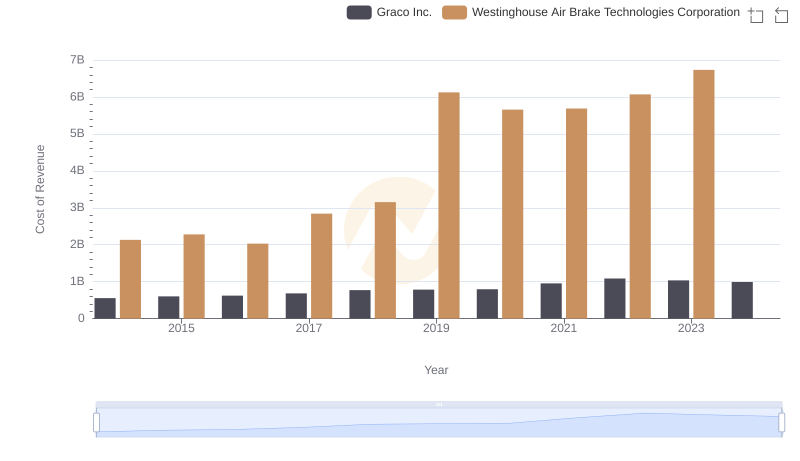
Cost of Revenue: Key Insights for Westinghouse Air Brake Technologies Corporation and Graco Inc.
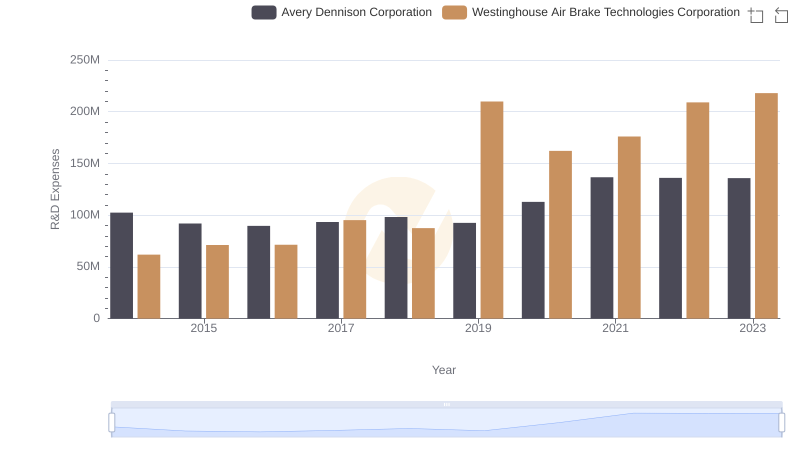
Westinghouse Air Brake Technologies Corporation or Avery Dennison Corporation: Who Invests More in Innovation?
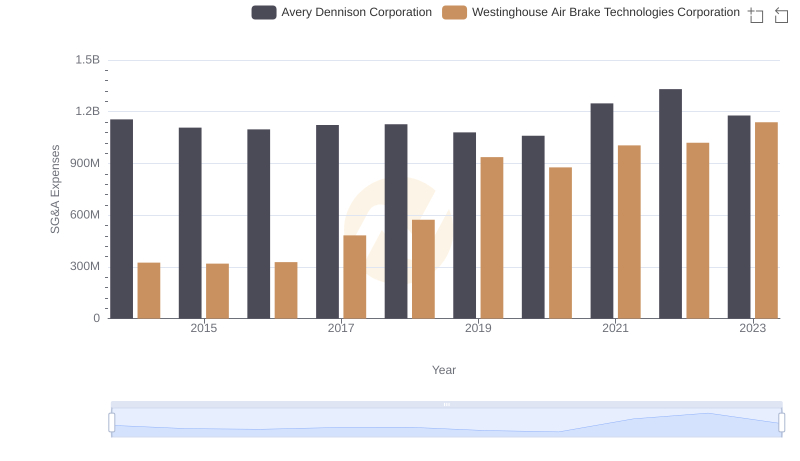
Westinghouse Air Brake Technologies Corporation vs Avery Dennison Corporation: SG&A Expense Trends
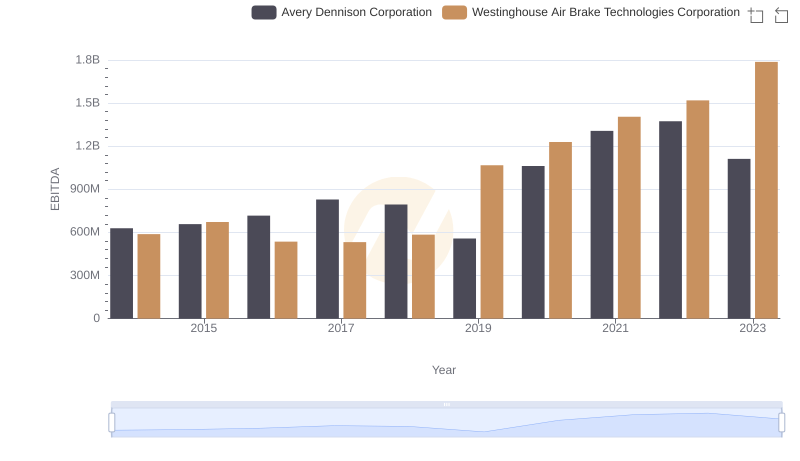
EBITDA Performance Review: Westinghouse Air Brake Technologies Corporation vs Avery Dennison Corporation