| __timestamp | Avery Dennison Corporation | Westinghouse Air Brake Technologies Corporation |
|---|---|---|
| Wednesday, January 1, 2014 | 1651200000 | 913534000 |
| Thursday, January 1, 2015 | 1645800000 | 1026153000 |
| Friday, January 1, 2016 | 1699700000 | 901541000 |
| Sunday, January 1, 2017 | 1812200000 | 1040597000 |
| Monday, January 1, 2018 | 1915500000 | 1211731000 |
| Tuesday, January 1, 2019 | 1904100000 | 2077600000 |
| Wednesday, January 1, 2020 | 1923300000 | 1898700000 |
| Friday, January 1, 2021 | 2312800000 | 2135000000 |
| Saturday, January 1, 2022 | 2404200000 | 2292000000 |
| Sunday, January 1, 2023 | 2277499999 | 2944000000 |
| Monday, January 1, 2024 | 2530700000 | 3366000000 |
Infusing magic into the data realm
In the competitive landscape of industrial and manufacturing sectors, Westinghouse Air Brake Technologies Corporation and Avery Dennison Corporation have showcased intriguing gross profit trends over the past decade. From 2014 to 2023, Avery Dennison's gross profit grew by approximately 38%, peaking in 2022. Meanwhile, Westinghouse Air Brake Technologies saw a remarkable 222% increase, culminating in 2023. This stark contrast highlights Westinghouse's aggressive growth strategy, outpacing Avery Dennison's steady climb.
The data reveals that while Avery Dennison maintained a consistent upward trajectory, Westinghouse's profits surged significantly post-2018, indicating strategic shifts or market expansions. These trends underscore the dynamic nature of the industry, where strategic decisions and market conditions can lead to vastly different financial outcomes. As we look to the future, these companies' ability to adapt and innovate will be crucial in sustaining their growth trajectories.
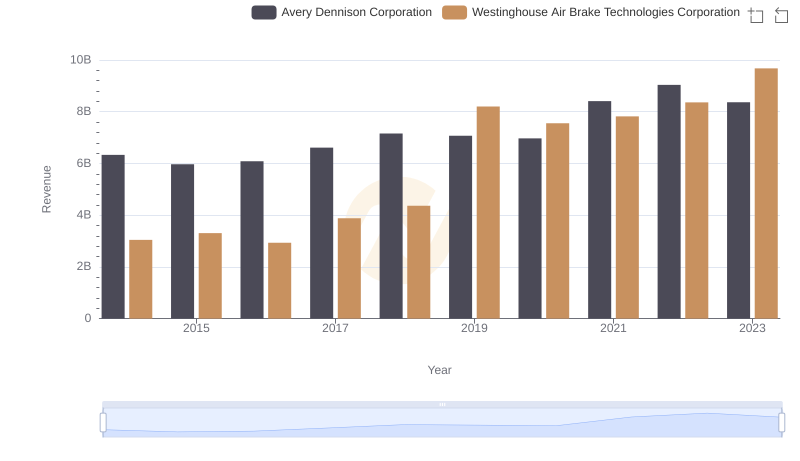
Annual Revenue Comparison: Westinghouse Air Brake Technologies Corporation vs Avery Dennison Corporation
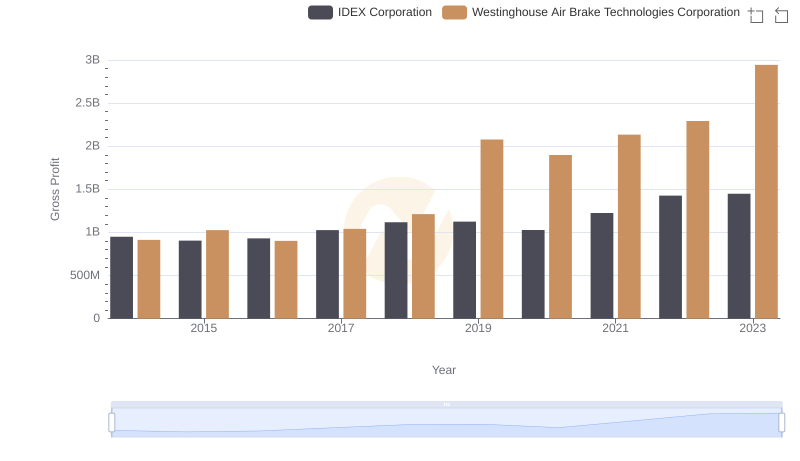
Key Insights on Gross Profit: Westinghouse Air Brake Technologies Corporation vs IDEX Corporation
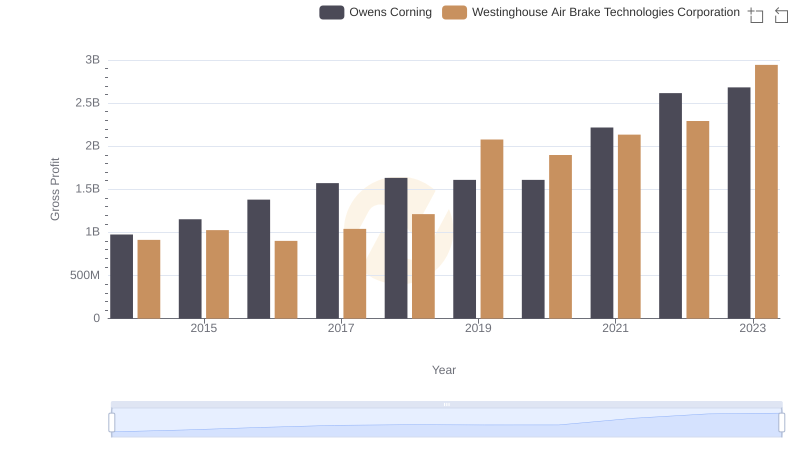
Gross Profit Analysis: Comparing Westinghouse Air Brake Technologies Corporation and Owens Corning
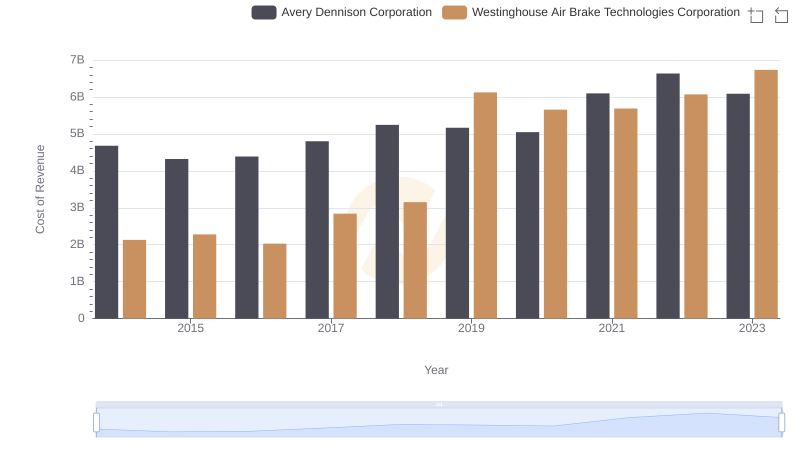
Cost of Revenue Trends: Westinghouse Air Brake Technologies Corporation vs Avery Dennison Corporation
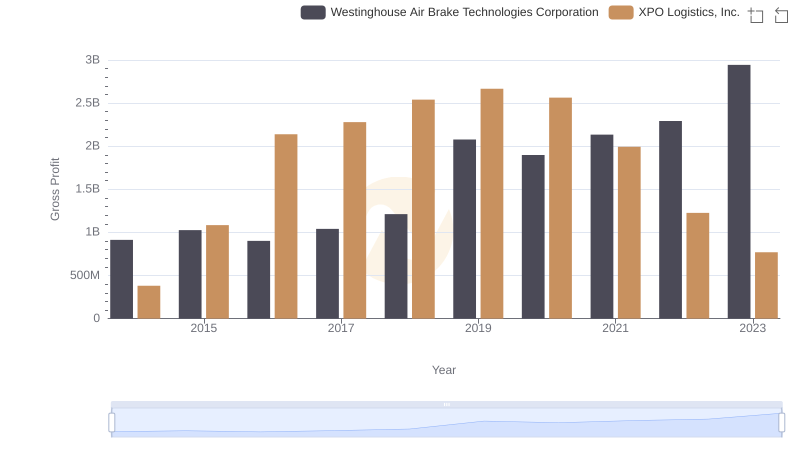
Who Generates Higher Gross Profit? Westinghouse Air Brake Technologies Corporation or XPO Logistics, Inc.
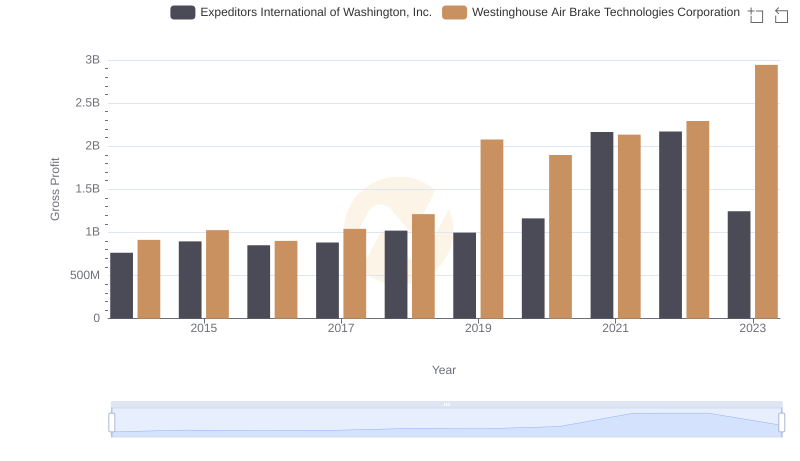
Westinghouse Air Brake Technologies Corporation vs Expeditors International of Washington, Inc.: A Gross Profit Performance Breakdown
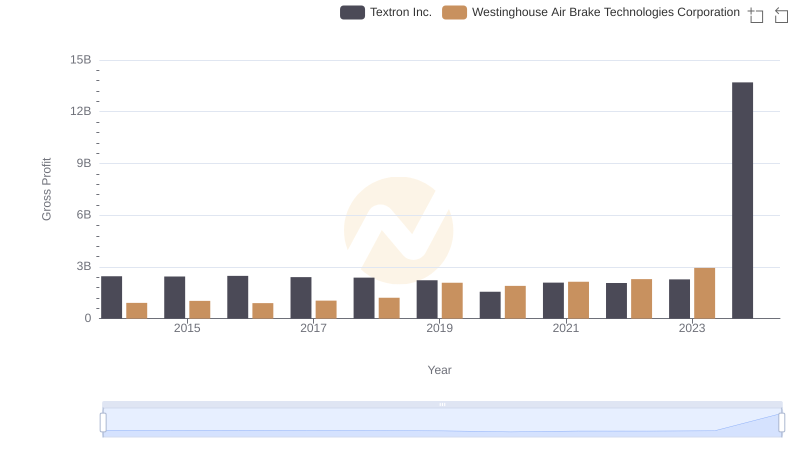
Westinghouse Air Brake Technologies Corporation vs Textron Inc.: A Gross Profit Performance Breakdown
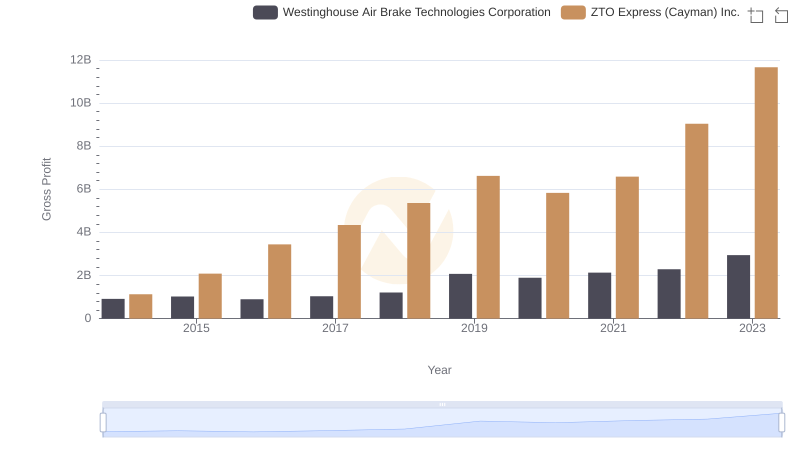
Westinghouse Air Brake Technologies Corporation and ZTO Express (Cayman) Inc.: A Detailed Gross Profit Analysis
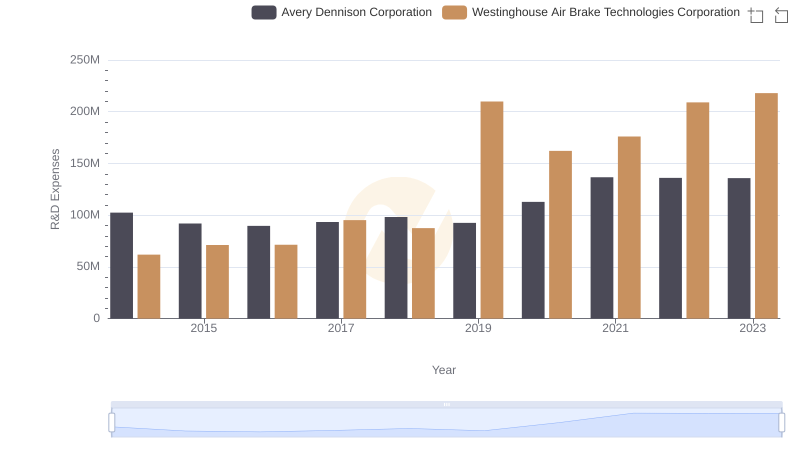
Westinghouse Air Brake Technologies Corporation or Avery Dennison Corporation: Who Invests More in Innovation?
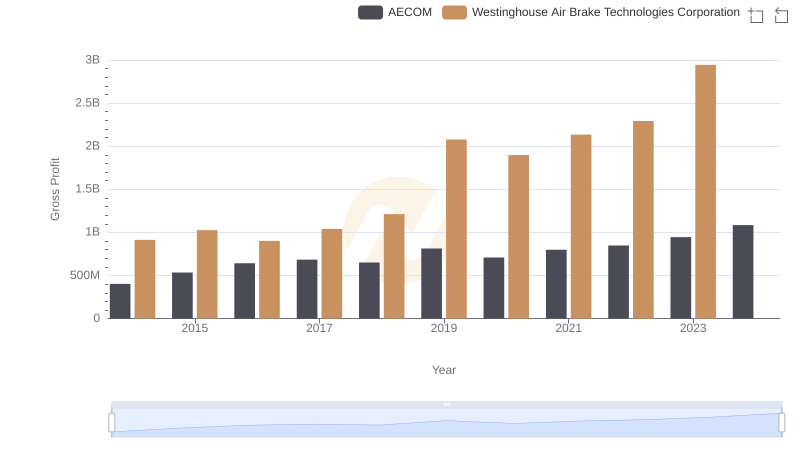
Gross Profit Comparison: Westinghouse Air Brake Technologies Corporation and AECOM Trends
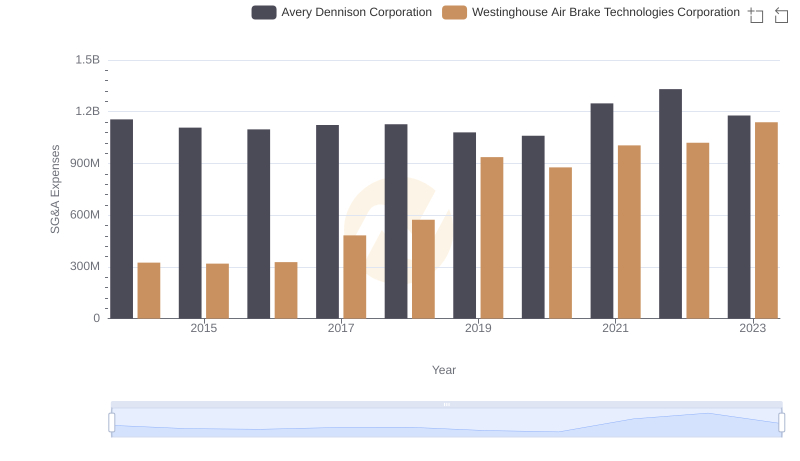
Westinghouse Air Brake Technologies Corporation vs Avery Dennison Corporation: SG&A Expense Trends
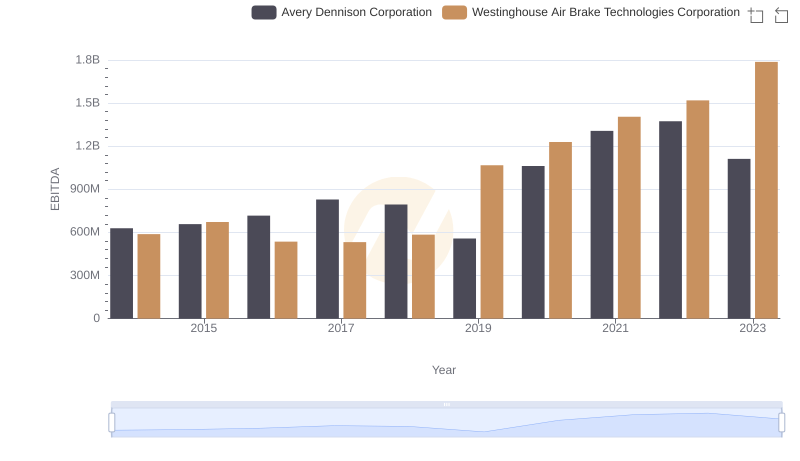
EBITDA Performance Review: Westinghouse Air Brake Technologies Corporation vs Avery Dennison Corporation