| __timestamp | Avery Dennison Corporation | Westinghouse Air Brake Technologies Corporation |
|---|---|---|
| Wednesday, January 1, 2014 | 6330300000 | 3044454000 |
| Thursday, January 1, 2015 | 5966900000 | 3307998000 |
| Friday, January 1, 2016 | 6086500000 | 2931188000 |
| Sunday, January 1, 2017 | 6613800000 | 3881756000 |
| Monday, January 1, 2018 | 7159000000 | 4363547000 |
| Tuesday, January 1, 2019 | 7070100000 | 8200000000 |
| Wednesday, January 1, 2020 | 6971500000 | 7556100000 |
| Friday, January 1, 2021 | 8408300000 | 7822000000 |
| Saturday, January 1, 2022 | 9039300000 | 8362000000 |
| Sunday, January 1, 2023 | 8364299999 | 9677000000 |
| Monday, January 1, 2024 | 8755700000 | 10387000000 |
Unveiling the hidden dimensions of data
In the ever-evolving landscape of industrial and consumer goods, Westinghouse Air Brake Technologies Corporation and Avery Dennison Corporation have showcased intriguing revenue trajectories over the past decade. From 2014 to 2023, Avery Dennison's revenue grew by approximately 32%, peaking in 2022. Meanwhile, Westinghouse Air Brake Technologies saw a remarkable 218% increase, culminating in 2023. This period highlights a significant shift in market dynamics, with Westinghouse Air Brake Technologies overtaking Avery Dennison in 2019 and maintaining its lead. The data reveals a competitive edge for Westinghouse, particularly in the latter half of the decade, as it capitalized on market opportunities. As we delve into these trends, it becomes evident that strategic positioning and market adaptability have been pivotal for these corporations. This analysis offers a window into the strategic maneuvers that have defined their financial journeys.
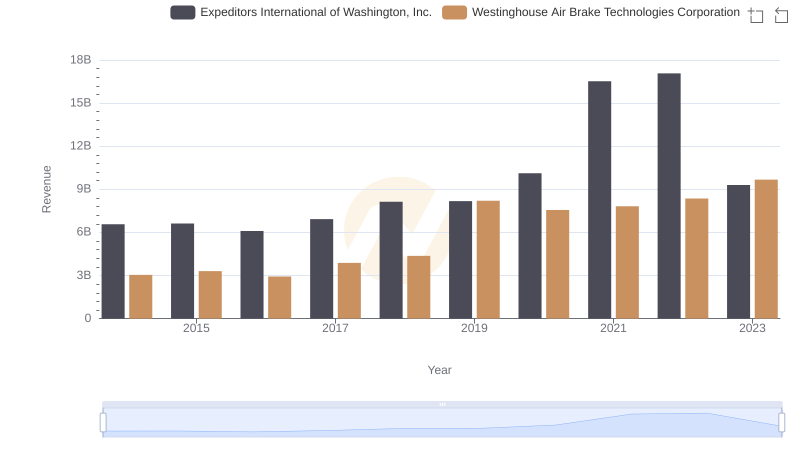
Comparing Revenue Performance: Westinghouse Air Brake Technologies Corporation or Expeditors International of Washington, Inc.?
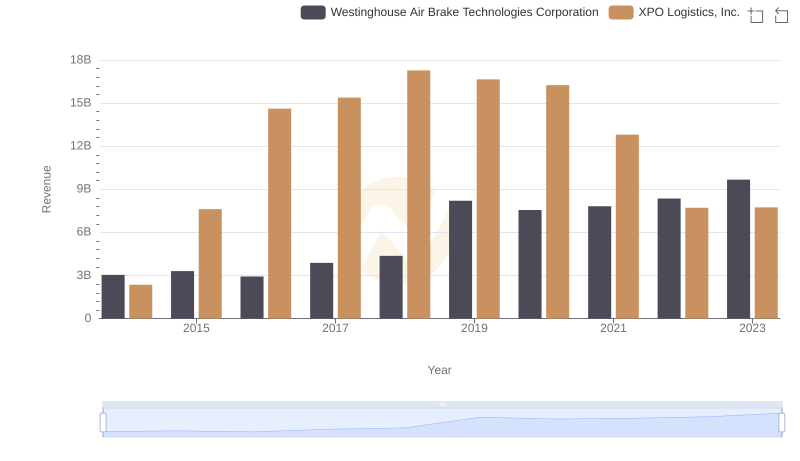
Comparing Revenue Performance: Westinghouse Air Brake Technologies Corporation or XPO Logistics, Inc.?
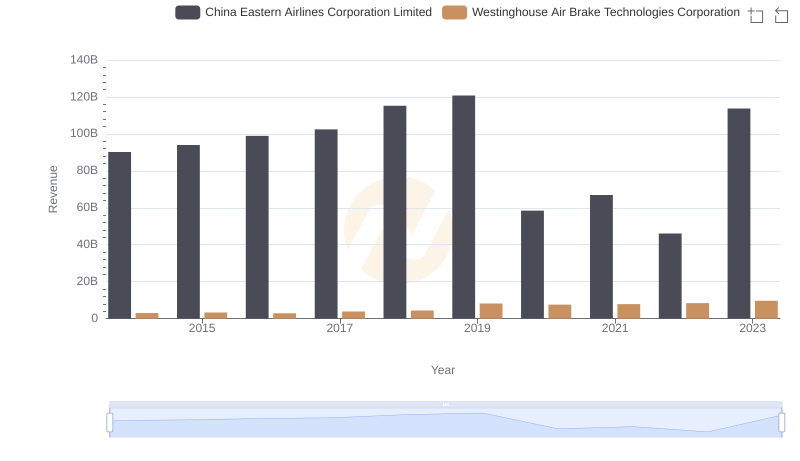
Revenue Insights: Westinghouse Air Brake Technologies Corporation and China Eastern Airlines Corporation Limited Performance Compared
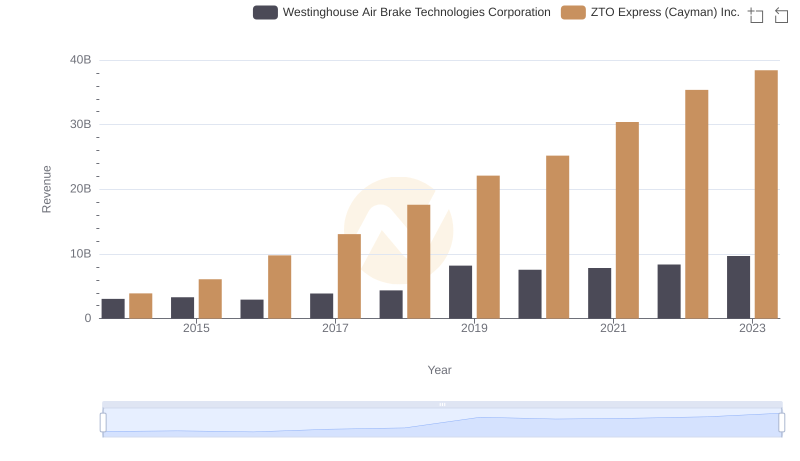
Who Generates More Revenue? Westinghouse Air Brake Technologies Corporation or ZTO Express (Cayman) Inc.
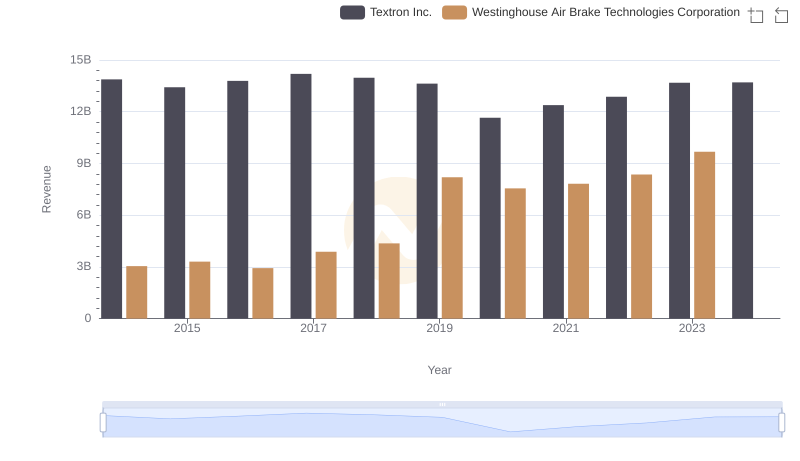
Westinghouse Air Brake Technologies Corporation or Textron Inc.: Who Leads in Yearly Revenue?
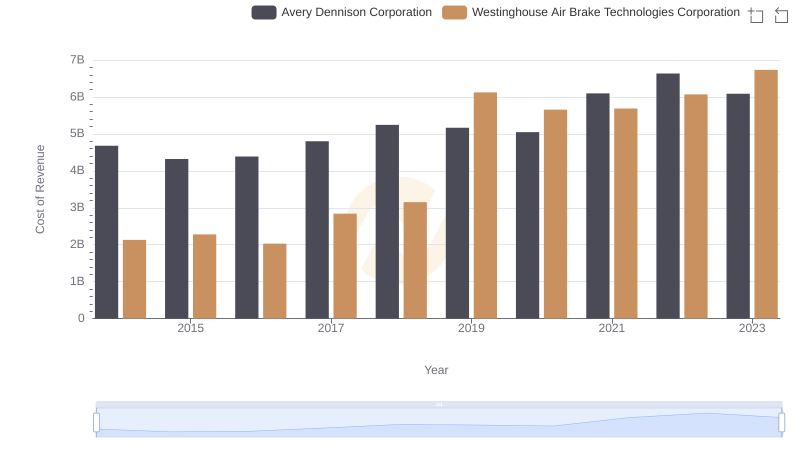
Cost of Revenue Trends: Westinghouse Air Brake Technologies Corporation vs Avery Dennison Corporation
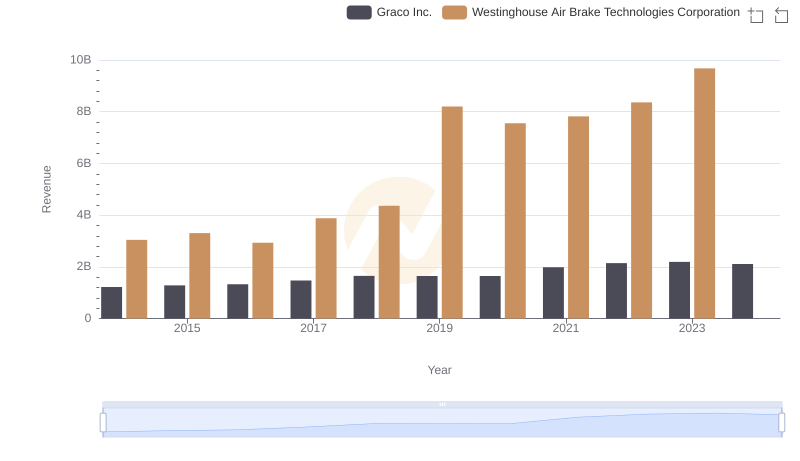
Westinghouse Air Brake Technologies Corporation vs Graco Inc.: Annual Revenue Growth Compared
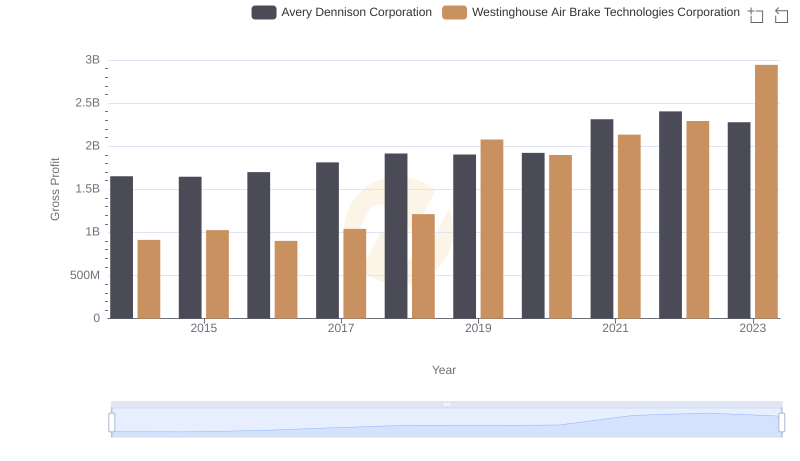
Gross Profit Trends Compared: Westinghouse Air Brake Technologies Corporation vs Avery Dennison Corporation
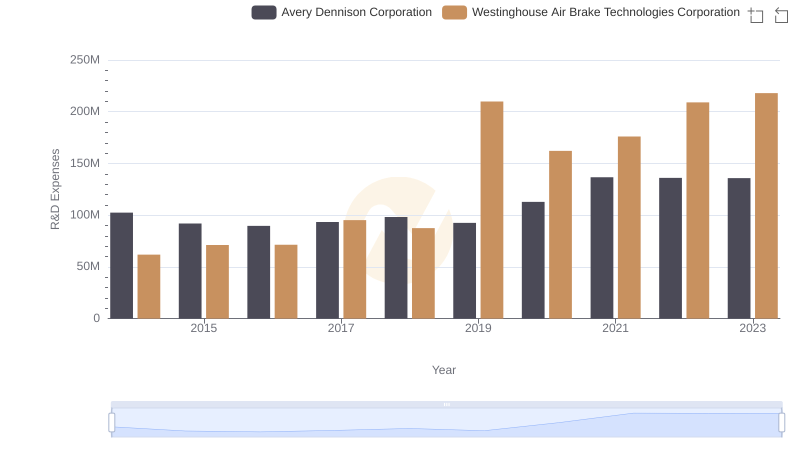
Westinghouse Air Brake Technologies Corporation or Avery Dennison Corporation: Who Invests More in Innovation?
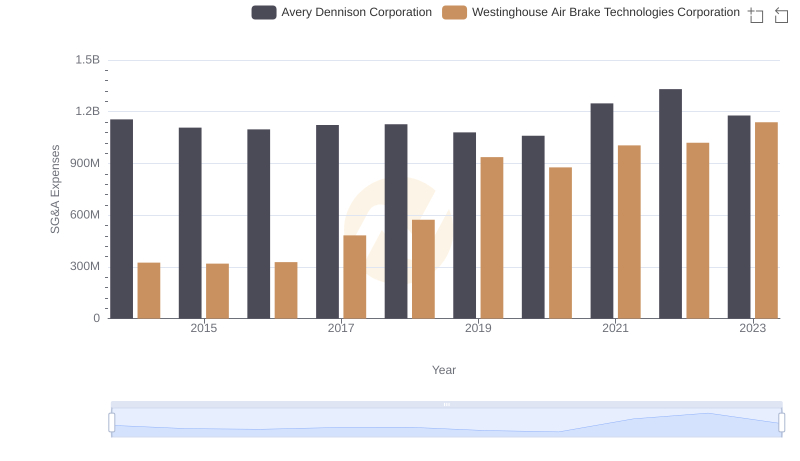
Westinghouse Air Brake Technologies Corporation vs Avery Dennison Corporation: SG&A Expense Trends
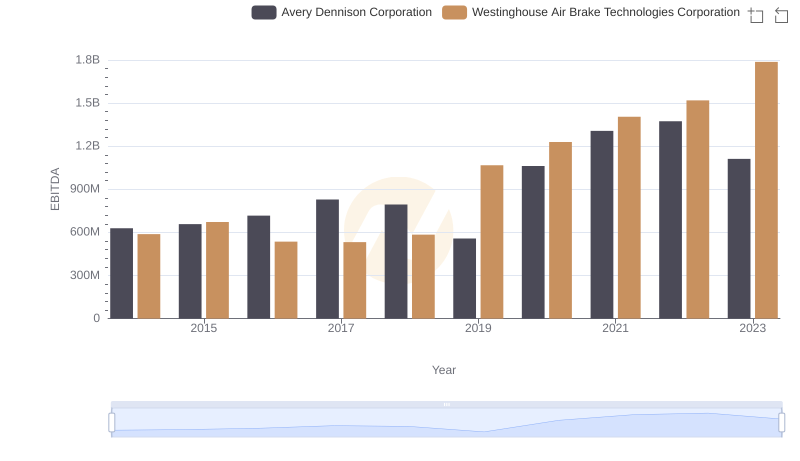
EBITDA Performance Review: Westinghouse Air Brake Technologies Corporation vs Avery Dennison Corporation