| __timestamp | Expeditors International of Washington, Inc. | Westinghouse Air Brake Technologies Corporation |
|---|---|---|
| Wednesday, January 1, 2014 | 5800725000 | 2130920000 |
| Thursday, January 1, 2015 | 5720848000 | 2281845000 |
| Friday, January 1, 2016 | 5247244000 | 2029647000 |
| Sunday, January 1, 2017 | 6037921000 | 2841159000 |
| Monday, January 1, 2018 | 7118083000 | 3151816000 |
| Tuesday, January 1, 2019 | 7178405000 | 6122400000 |
| Wednesday, January 1, 2020 | 8953716000 | 5657400000 |
| Friday, January 1, 2021 | 14358105000 | 5687000000 |
| Saturday, January 1, 2022 | 14900154000 | 6070000000 |
| Sunday, January 1, 2023 | 8054634000 | 6733000000 |
| Monday, January 1, 2024 | 0 | 7021000000 |
In pursuit of knowledge
In the ever-evolving landscape of the transportation and logistics industry, understanding cost dynamics is crucial. Over the past decade, Westinghouse Air Brake Technologies Corporation and Expeditors International of Washington, Inc. have showcased intriguing trends in their cost of revenue. From 2014 to 2023, Expeditors International experienced a significant surge, peaking in 2022 with a 184% increase from its 2016 low. Meanwhile, Westinghouse Air Brake Technologies saw a steady rise, culminating in a 232% growth by 2023 compared to 2014. This data highlights the resilience and adaptability of these companies amidst economic fluctuations. As the industry continues to face challenges, such insights are invaluable for stakeholders aiming to optimize operational efficiency and strategic planning. Dive deeper into these trends to uncover the factors driving these cost dynamics and their implications for future growth.
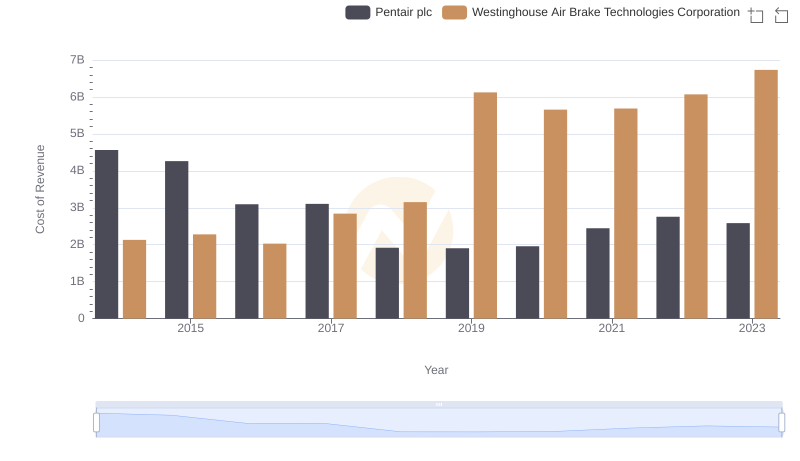
Analyzing Cost of Revenue: Westinghouse Air Brake Technologies Corporation and Pentair plc
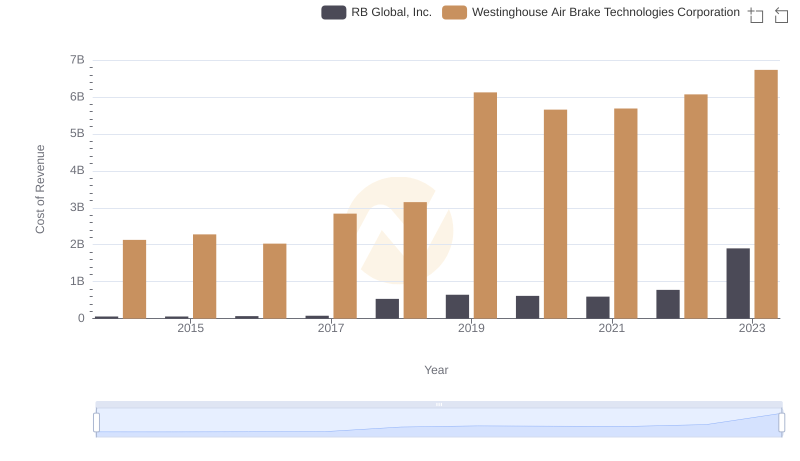
Comparing Cost of Revenue Efficiency: Westinghouse Air Brake Technologies Corporation vs RB Global, Inc.
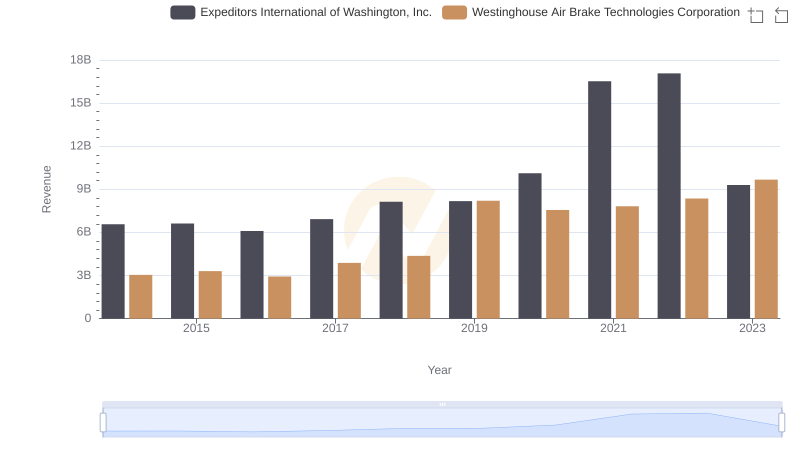
Comparing Revenue Performance: Westinghouse Air Brake Technologies Corporation or Expeditors International of Washington, Inc.?
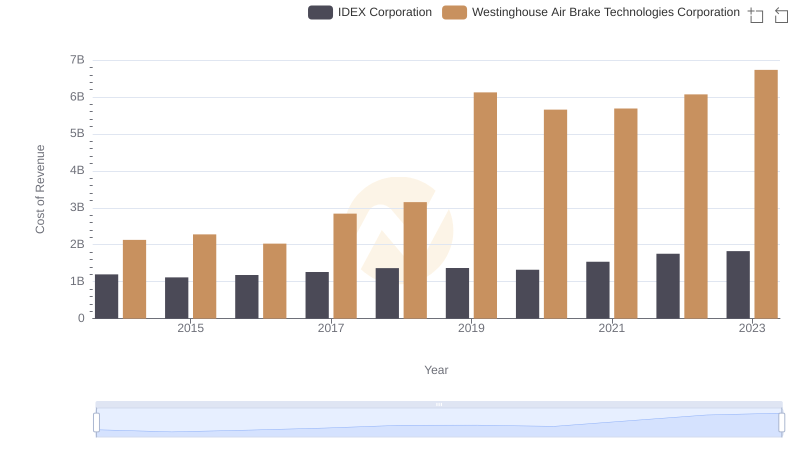
Comparing Cost of Revenue Efficiency: Westinghouse Air Brake Technologies Corporation vs IDEX Corporation
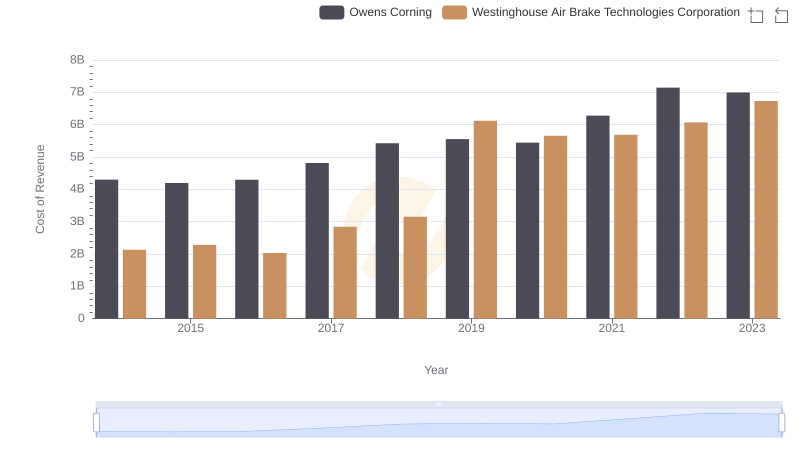
Westinghouse Air Brake Technologies Corporation vs Owens Corning: Efficiency in Cost of Revenue Explored
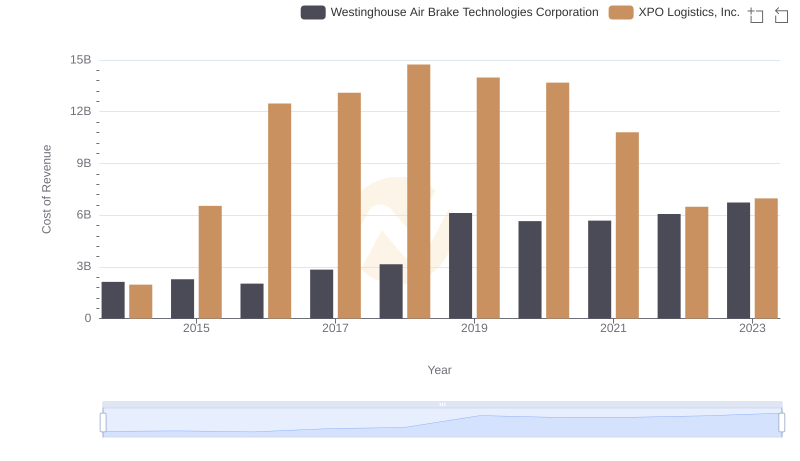
Cost of Revenue Trends: Westinghouse Air Brake Technologies Corporation vs XPO Logistics, Inc.
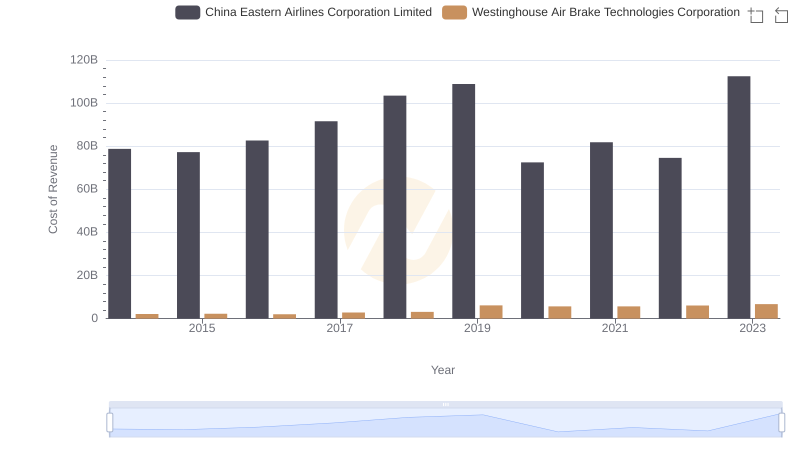
Cost of Revenue Trends: Westinghouse Air Brake Technologies Corporation vs China Eastern Airlines Corporation Limited
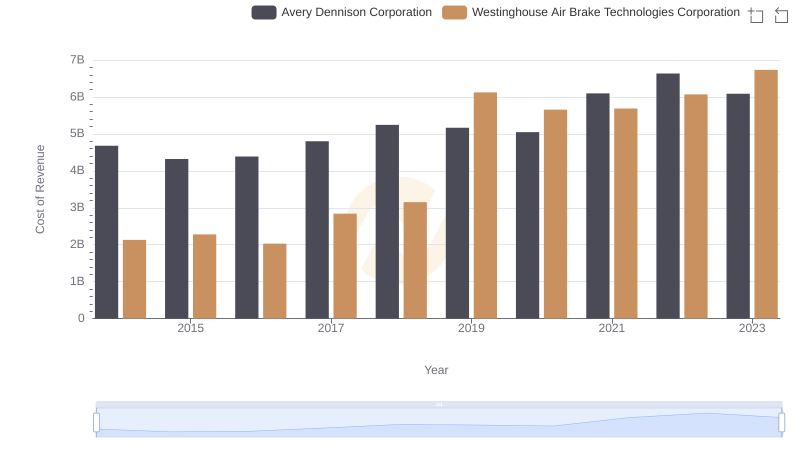
Cost of Revenue Trends: Westinghouse Air Brake Technologies Corporation vs Avery Dennison Corporation
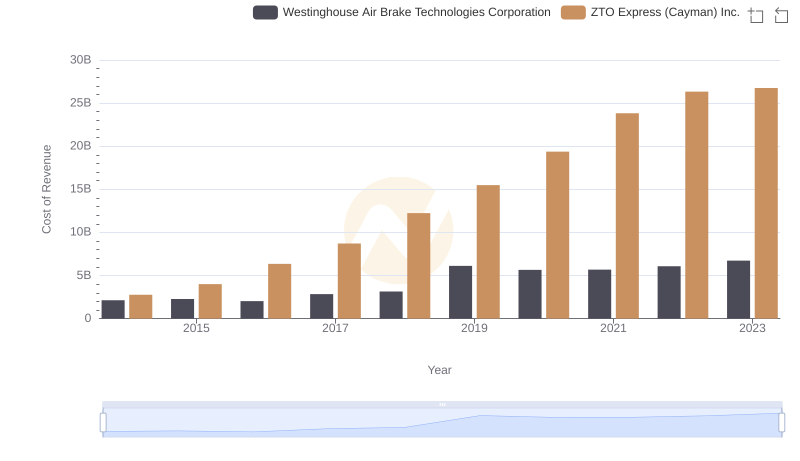
Cost of Revenue Trends: Westinghouse Air Brake Technologies Corporation vs ZTO Express (Cayman) Inc.
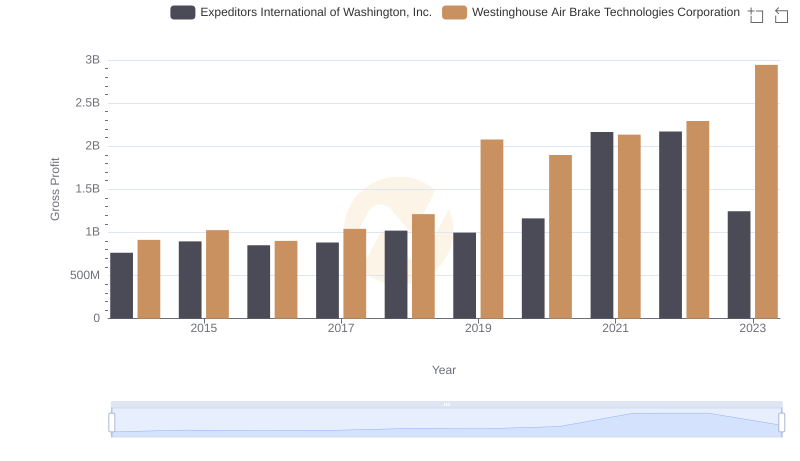
Westinghouse Air Brake Technologies Corporation vs Expeditors International of Washington, Inc.: A Gross Profit Performance Breakdown
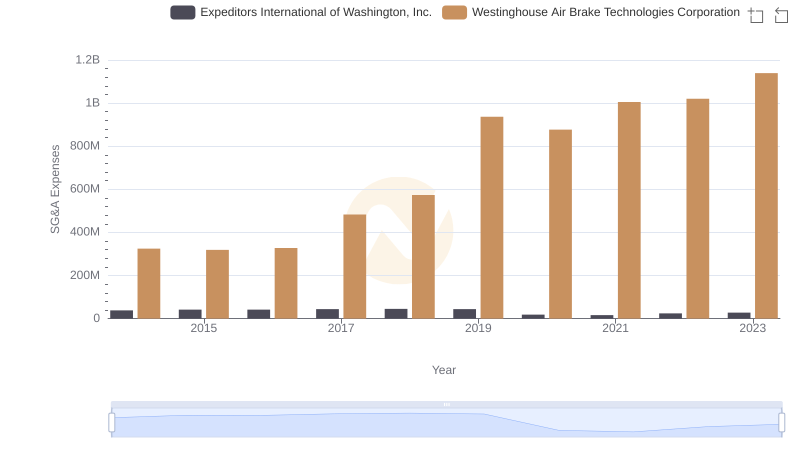
Breaking Down SG&A Expenses: Westinghouse Air Brake Technologies Corporation vs Expeditors International of Washington, Inc.
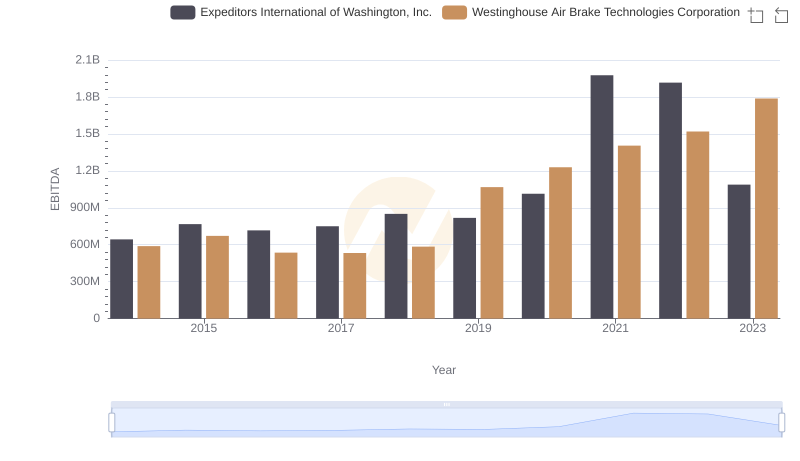
A Professional Review of EBITDA: Westinghouse Air Brake Technologies Corporation Compared to Expeditors International of Washington, Inc.