| __timestamp | J.B. Hunt Transport Services, Inc. | United Airlines Holdings, Inc. |
|---|---|---|
| Wednesday, January 1, 2014 | 6165441000 | 38901000000 |
| Thursday, January 1, 2015 | 6187646000 | 37864000000 |
| Friday, January 1, 2016 | 6555459000 | 36556000000 |
| Sunday, January 1, 2017 | 7189568000 | 37736000000 |
| Monday, January 1, 2018 | 8614874000 | 41303000000 |
| Tuesday, January 1, 2019 | 9165258000 | 43259000000 |
| Wednesday, January 1, 2020 | 9636573000 | 15355000000 |
| Friday, January 1, 2021 | 12168302000 | 24634000000 |
| Saturday, January 1, 2022 | 14813999000 | 44955000000 |
| Sunday, January 1, 2023 | 12829665000 | 53717000000 |
| Monday, January 1, 2024 | 57063000000 |
Unleashing insights
In the ever-evolving landscape of American transportation, United Airlines Holdings, Inc. and J.B. Hunt Transport Services, Inc. stand as titans in their respective domains. Over the past decade, these companies have showcased remarkable resilience and growth. From 2014 to 2023, United Airlines' revenue soared by approximately 38%, despite a significant dip in 2020 due to the global pandemic. Meanwhile, J.B. Hunt Transport Services experienced a steady climb, with a 108% increase in revenue over the same period.
These trends underscore the dynamic nature of the transportation industry, where adaptability and strategic foresight are paramount.
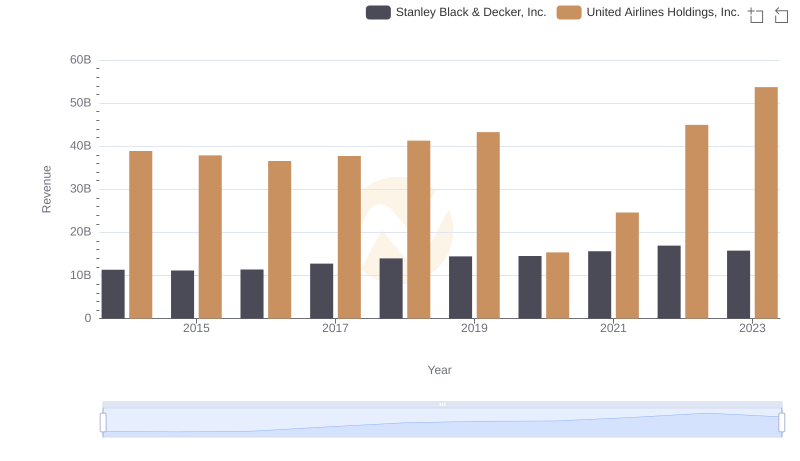
Breaking Down Revenue Trends: United Airlines Holdings, Inc. vs Stanley Black & Decker, Inc.
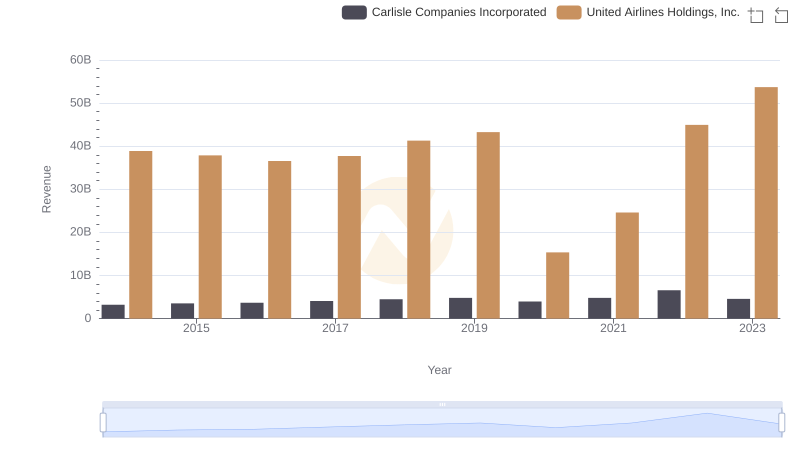
United Airlines Holdings, Inc. or Carlisle Companies Incorporated: Who Leads in Yearly Revenue?
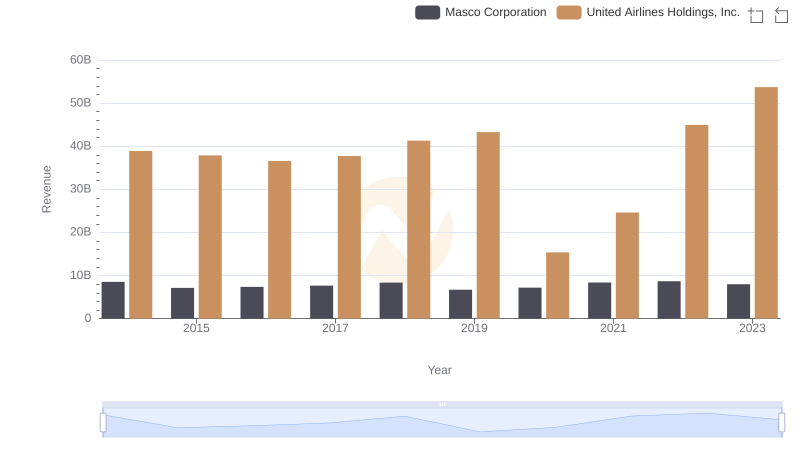
Breaking Down Revenue Trends: United Airlines Holdings, Inc. vs Masco Corporation
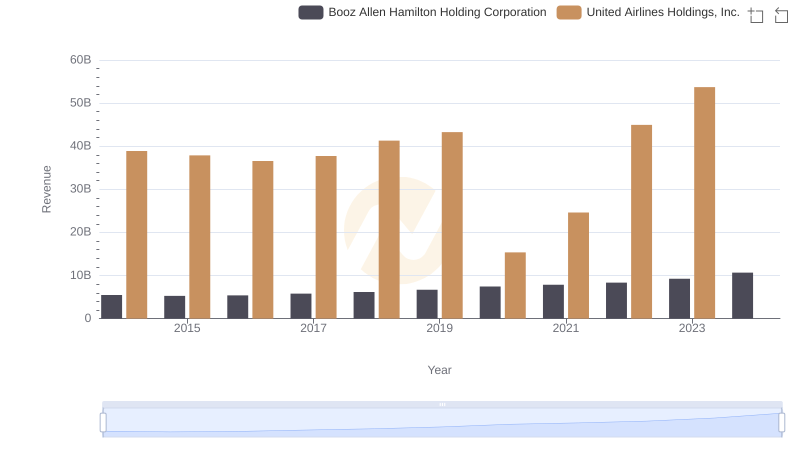
Who Generates More Revenue? United Airlines Holdings, Inc. or Booz Allen Hamilton Holding Corporation
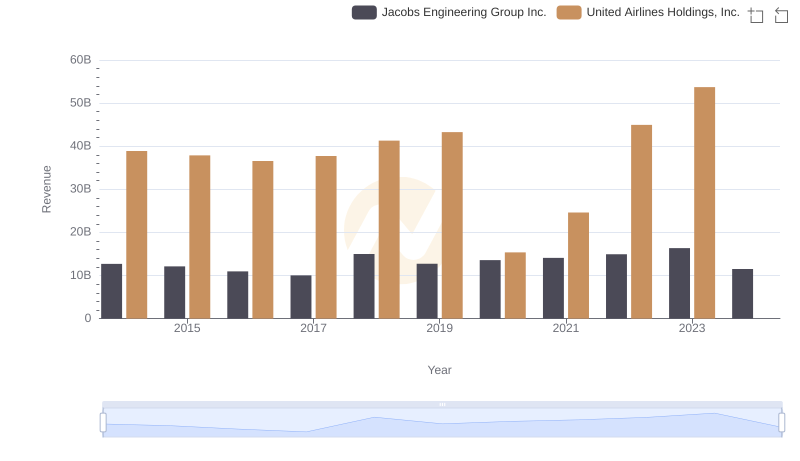
Annual Revenue Comparison: United Airlines Holdings, Inc. vs Jacobs Engineering Group Inc.
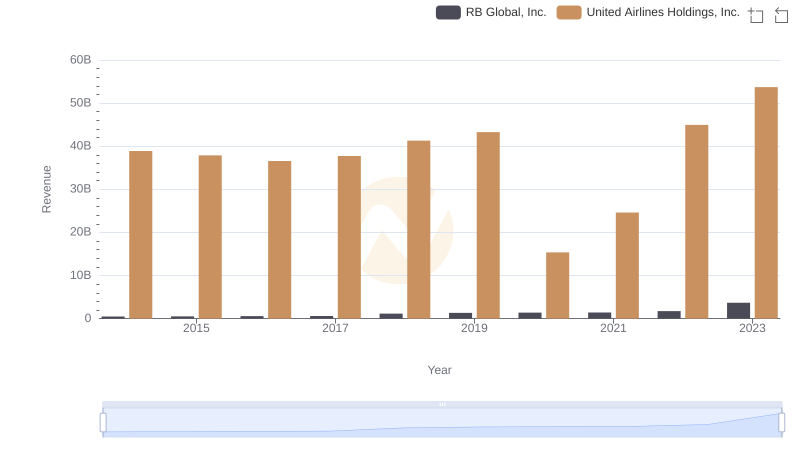
Revenue Insights: United Airlines Holdings, Inc. and RB Global, Inc. Performance Compared
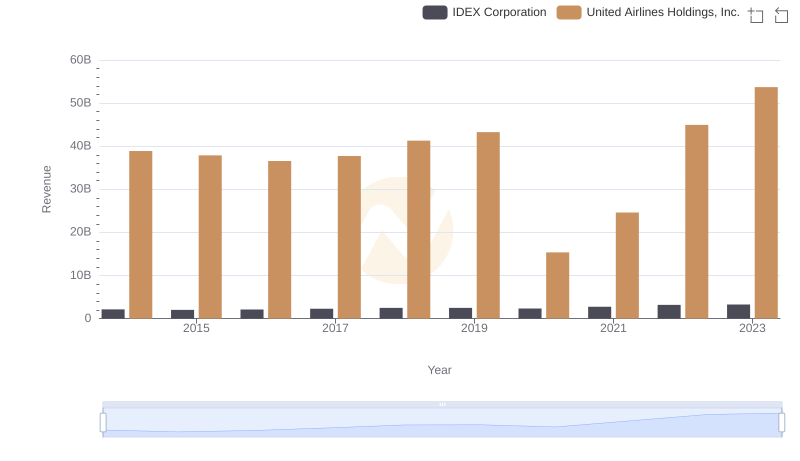
United Airlines Holdings, Inc. vs IDEX Corporation: Annual Revenue Growth Compared
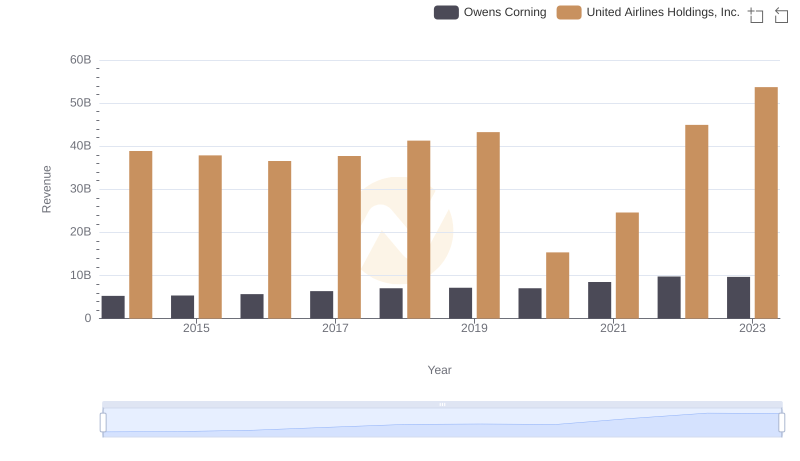
United Airlines Holdings, Inc. or Owens Corning: Who Leads in Yearly Revenue?
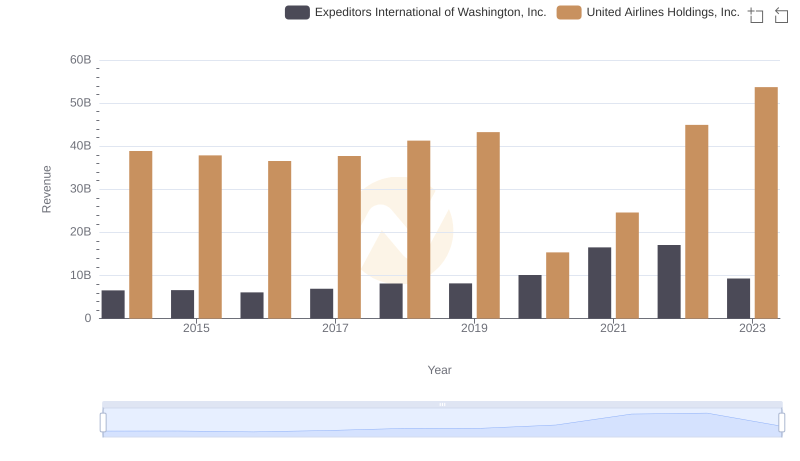
Revenue Insights: United Airlines Holdings, Inc. and Expeditors International of Washington, Inc. Performance Compared
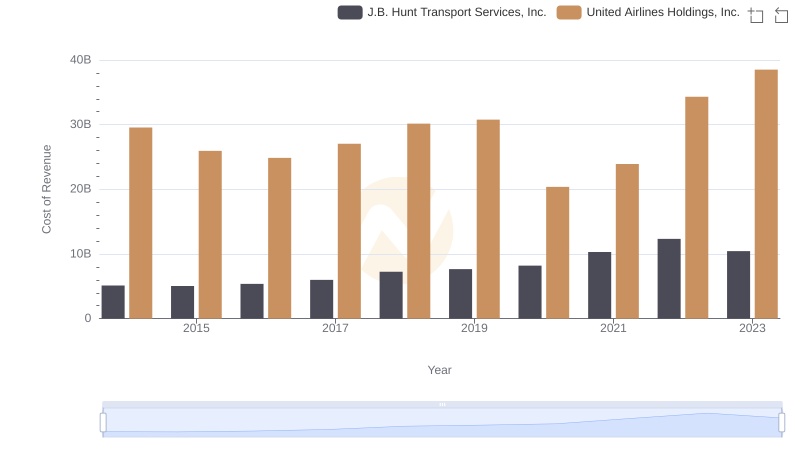
Cost of Revenue Trends: United Airlines Holdings, Inc. vs J.B. Hunt Transport Services, Inc.
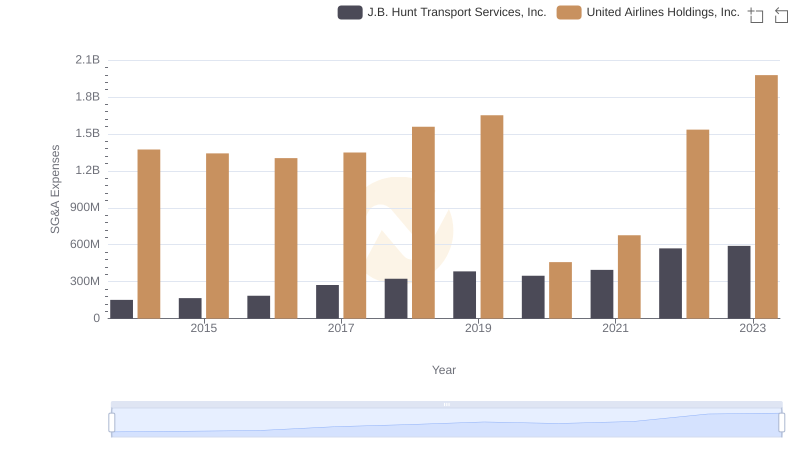
Who Optimizes SG&A Costs Better? United Airlines Holdings, Inc. or J.B. Hunt Transport Services, Inc.