| __timestamp | IDEX Corporation | United Airlines Holdings, Inc. |
|---|---|---|
| Wednesday, January 1, 2014 | 1198452000 | 29569000000 |
| Thursday, January 1, 2015 | 1116353000 | 25952000000 |
| Friday, January 1, 2016 | 1182276000 | 24856000000 |
| Sunday, January 1, 2017 | 1260634000 | 27056000000 |
| Monday, January 1, 2018 | 1365771000 | 30165000000 |
| Tuesday, January 1, 2019 | 1369539000 | 30786000000 |
| Wednesday, January 1, 2020 | 1324222000 | 20385000000 |
| Friday, January 1, 2021 | 1540300000 | 23913000000 |
| Saturday, January 1, 2022 | 1755000000 | 34315000000 |
| Sunday, January 1, 2023 | 1825400000 | 38518000000 |
| Monday, January 1, 2024 | 1814000000 | 37643000000 |
Unveiling the hidden dimensions of data
In the ever-evolving landscape of American business, the cost of revenue serves as a critical indicator of operational efficiency. This analysis juxtaposes United Airlines Holdings, Inc., a titan in the aviation industry, with IDEX Corporation, a leader in fluid and metering technologies. From 2014 to 2023, United Airlines experienced a 30% fluctuation in its cost of revenue, peaking in 2023 with a 35% increase from its 2020 low. Meanwhile, IDEX Corporation demonstrated a steady upward trend, with a 52% increase over the same period, reflecting its robust growth strategy.
The data reveals the contrasting dynamics of these industries. While United Airlines faced volatility due to external factors like fuel prices and global events, IDEX's consistent growth underscores its resilience and strategic market positioning. This comparison offers valuable insights into how different sectors navigate economic challenges and opportunities.
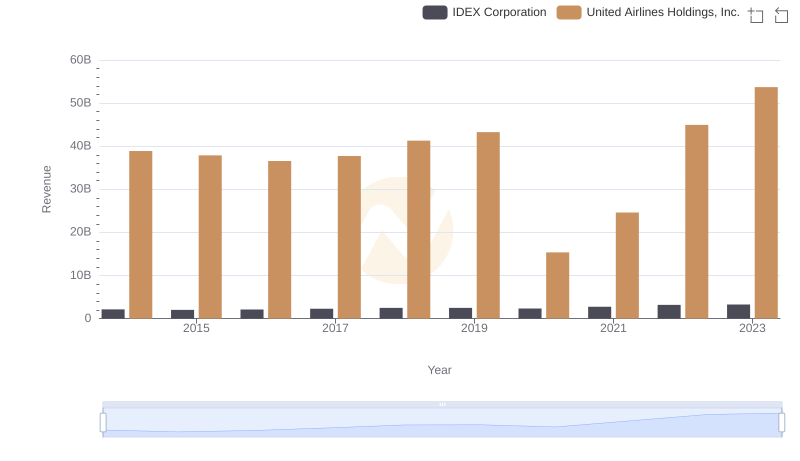
United Airlines Holdings, Inc. vs IDEX Corporation: Annual Revenue Growth Compared
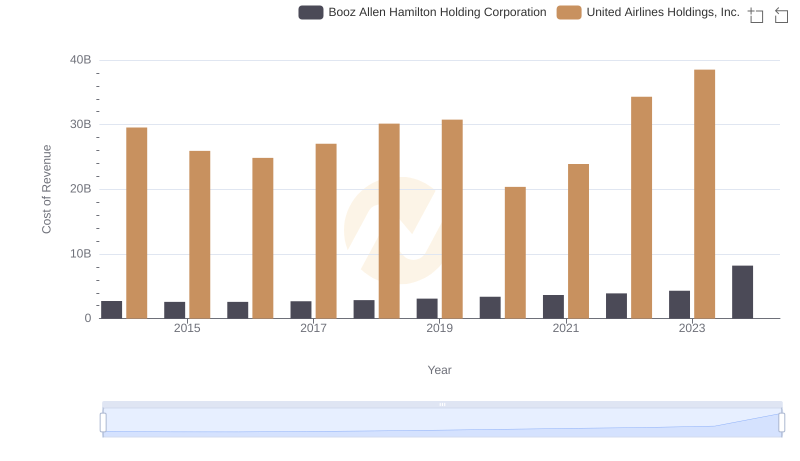
Cost of Revenue Trends: United Airlines Holdings, Inc. vs Booz Allen Hamilton Holding Corporation
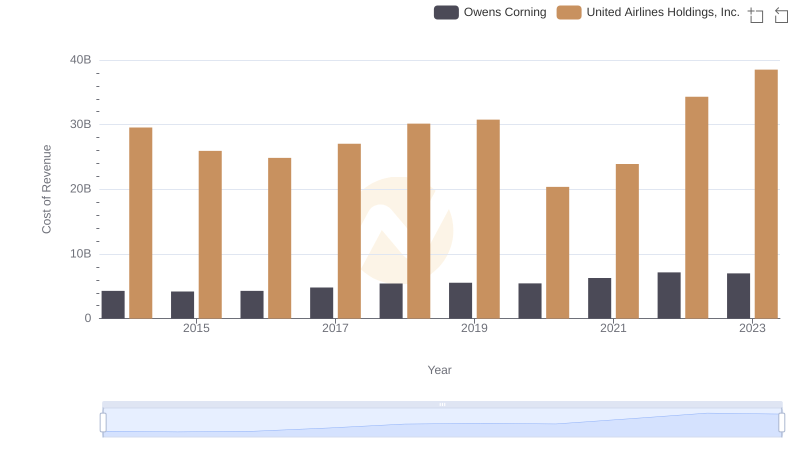
Cost of Revenue: Key Insights for United Airlines Holdings, Inc. and Owens Corning
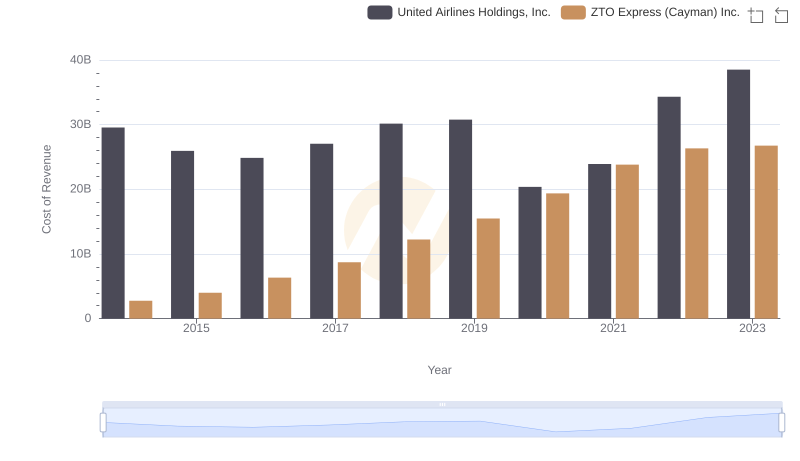
Cost Insights: Breaking Down United Airlines Holdings, Inc. and ZTO Express (Cayman) Inc.'s Expenses