| __timestamp | Jacobs Engineering Group Inc. | Union Pacific Corporation |
|---|---|---|
| Wednesday, January 1, 2014 | 10621373000 | 14311000000 |
| Thursday, January 1, 2015 | 10146494000 | 12837000000 |
| Friday, January 1, 2016 | 9196326000 | 11672000000 |
| Sunday, January 1, 2017 | 8250536000 | 12231000000 |
| Monday, January 1, 2018 | 12156276000 | 13293000000 |
| Tuesday, January 1, 2019 | 10260840000 | 12094000000 |
| Wednesday, January 1, 2020 | 10980307000 | 10354000000 |
| Friday, January 1, 2021 | 11048860000 | 11290000000 |
| Saturday, January 1, 2022 | 11595785000 | 13670000000 |
| Sunday, January 1, 2023 | 12879099000 | 13590000000 |
| Monday, January 1, 2024 | 8668185000 | 13211000000 |
Unleashing insights
In the ever-evolving landscape of American industry, Union Pacific Corporation and Jacobs Engineering Group Inc. stand as titans in their respective fields. Over the past decade, these companies have navigated the complexities of cost management with varying degrees of success.
From 2014 to 2023, Union Pacific Corporation consistently maintained a higher cost of revenue, peaking in 2014 and 2022 with figures around 1.4 times that of Jacobs Engineering. However, Jacobs Engineering showcased a remarkable recovery in 2023, achieving a 25% increase from its 2017 low. This resurgence highlights the company's strategic adaptability in a competitive market.
As we look to the future, the data suggests a narrowing gap between these industry leaders. The trends underscore the importance of strategic cost management in sustaining growth and competitiveness in the modern economy.
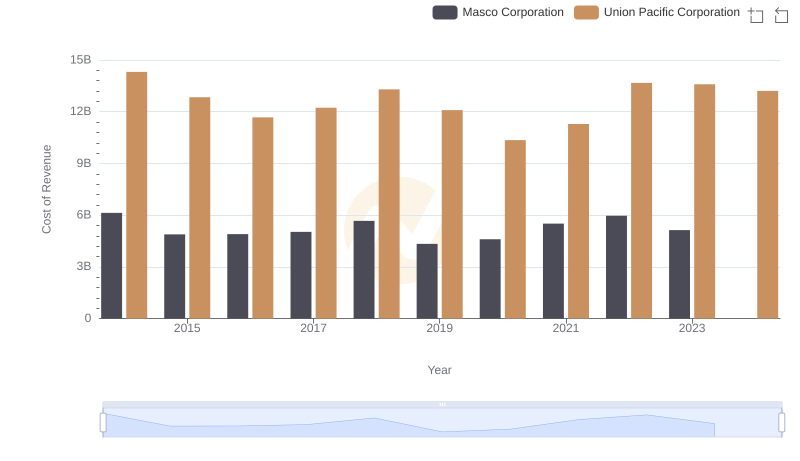
Cost of Revenue Trends: Union Pacific Corporation vs Masco Corporation
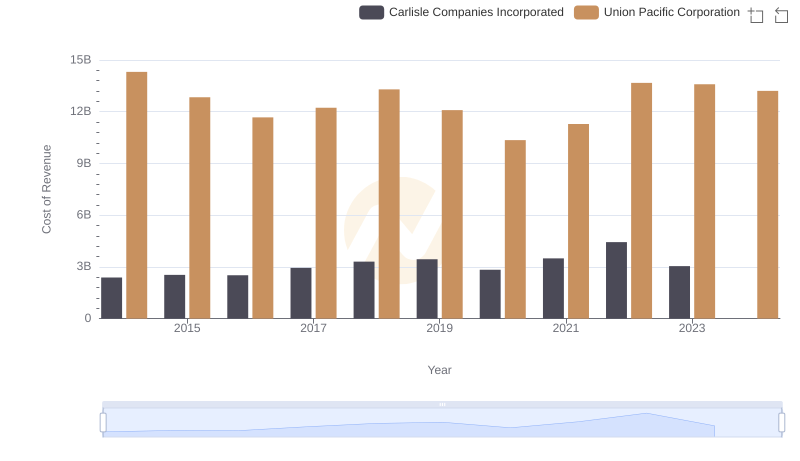
Cost of Revenue Trends: Union Pacific Corporation vs Carlisle Companies Incorporated
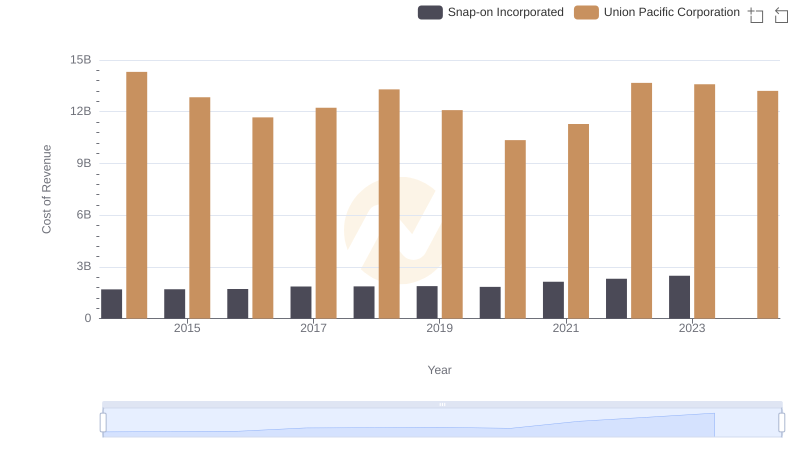
Cost of Revenue Trends: Union Pacific Corporation vs Snap-on Incorporated
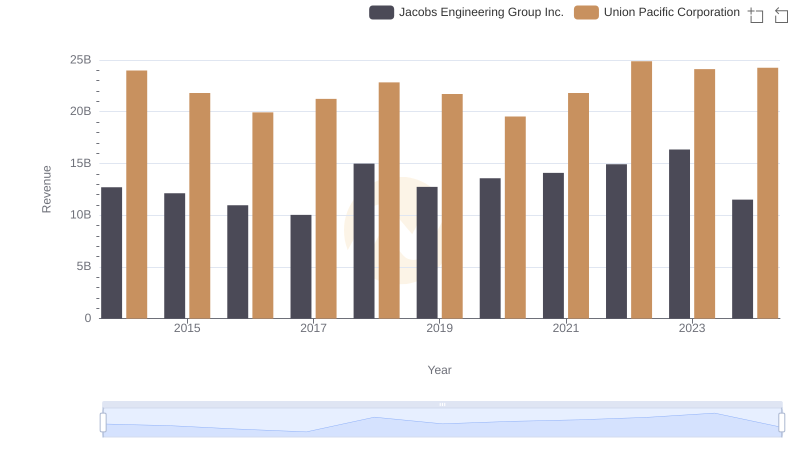
Comparing Revenue Performance: Union Pacific Corporation or Jacobs Engineering Group Inc.?
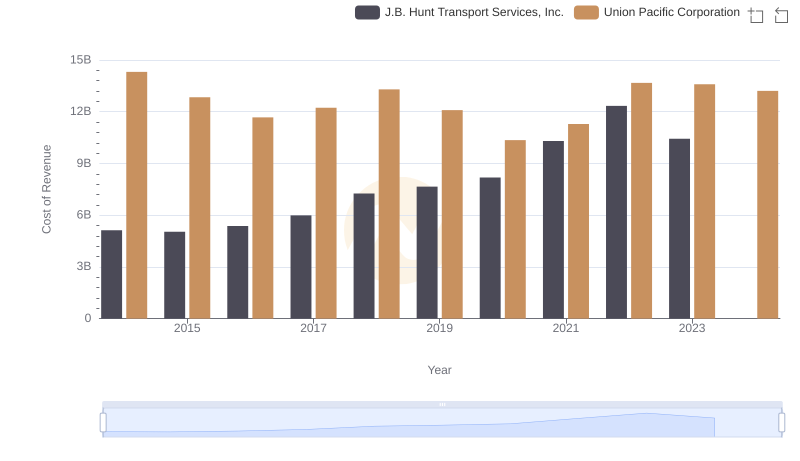
Analyzing Cost of Revenue: Union Pacific Corporation and J.B. Hunt Transport Services, Inc.
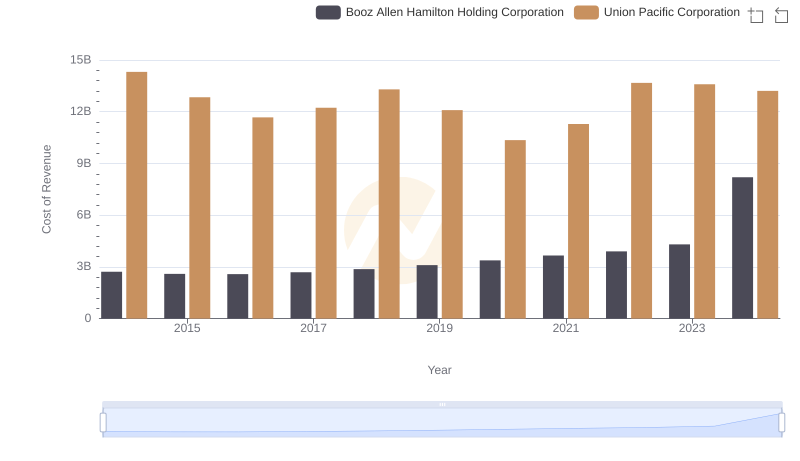
Cost of Revenue Comparison: Union Pacific Corporation vs Booz Allen Hamilton Holding Corporation
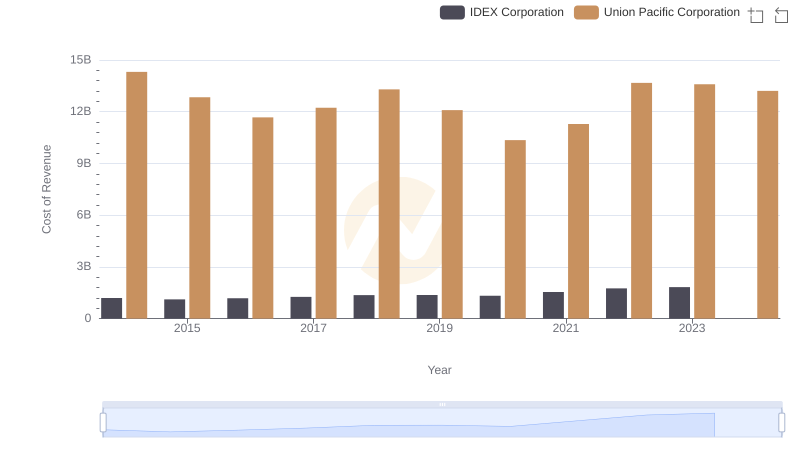
Cost of Revenue Comparison: Union Pacific Corporation vs IDEX Corporation
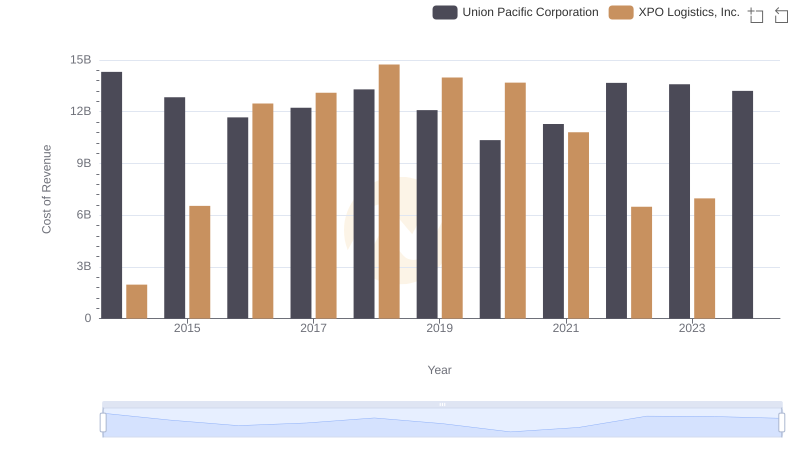
Comparing Cost of Revenue Efficiency: Union Pacific Corporation vs XPO Logistics, Inc.

Comprehensive EBITDA Comparison: Union Pacific Corporation vs Jacobs Engineering Group Inc.