| __timestamp | Jacobs Engineering Group Inc. | Union Pacific Corporation |
|---|---|---|
| Wednesday, January 1, 2014 | 12695157000 | 23988000000 |
| Thursday, January 1, 2015 | 12114832000 | 21813000000 |
| Friday, January 1, 2016 | 10964157000 | 19941000000 |
| Sunday, January 1, 2017 | 10022788000 | 21240000000 |
| Monday, January 1, 2018 | 14984646000 | 22832000000 |
| Tuesday, January 1, 2019 | 12737868000 | 21708000000 |
| Wednesday, January 1, 2020 | 13566975000 | 19533000000 |
| Friday, January 1, 2021 | 14092632000 | 21804000000 |
| Saturday, January 1, 2022 | 14922825000 | 24875000000 |
| Sunday, January 1, 2023 | 16352414000 | 24119000000 |
| Monday, January 1, 2024 | 11500941000 | 24250000000 |
In pursuit of knowledge
In the ever-evolving landscape of American industry, Union Pacific Corporation and Jacobs Engineering Group Inc. stand as titans in their respective fields. Over the past decade, from 2014 to 2024, these companies have showcased distinct revenue trajectories. Union Pacific, a stalwart in the railroad sector, consistently outperformed Jacobs Engineering, a leader in technical professional services, with revenues averaging around 70% higher annually.
These trends highlight the dynamic nature of these industries and the strategic maneuvers each company has employed to navigate challenges and capitalize on opportunities.
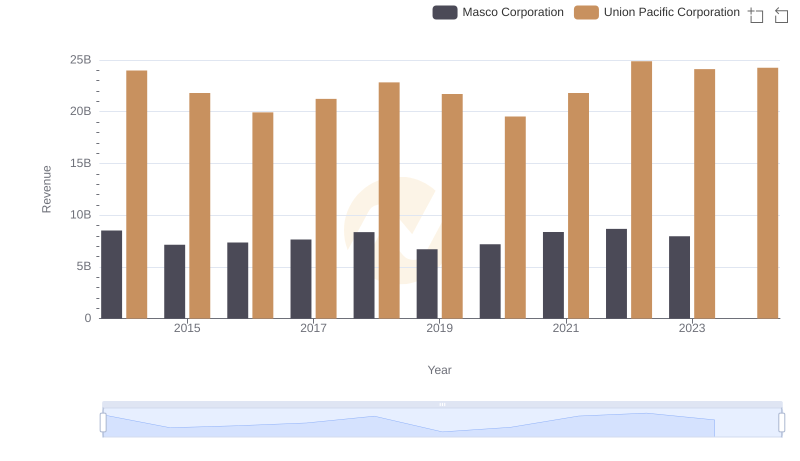
Annual Revenue Comparison: Union Pacific Corporation vs Masco Corporation
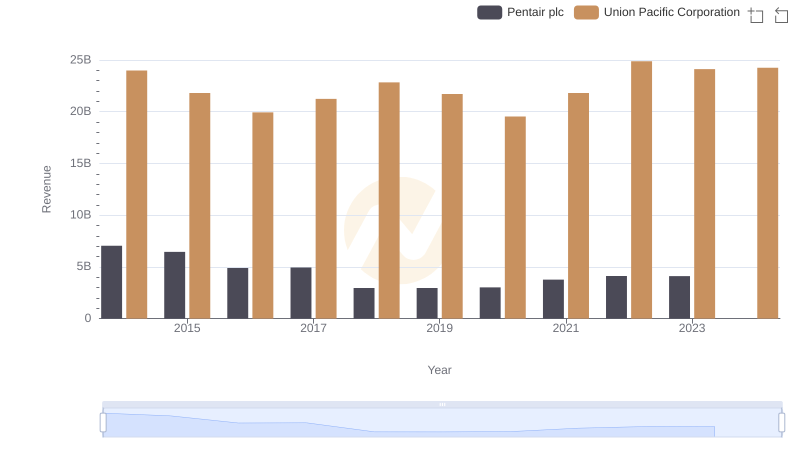
Union Pacific Corporation and Pentair plc: A Comprehensive Revenue Analysis
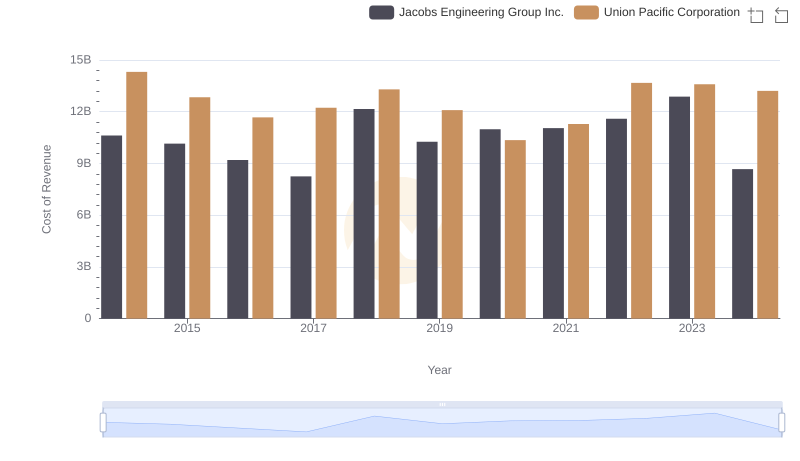
Cost of Revenue Trends: Union Pacific Corporation vs Jacobs Engineering Group Inc.
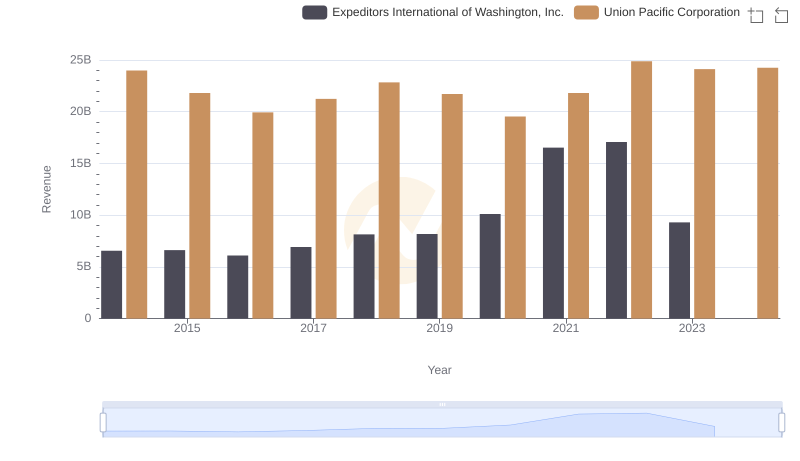
Revenue Insights: Union Pacific Corporation and Expeditors International of Washington, Inc. Performance Compared

Comprehensive EBITDA Comparison: Union Pacific Corporation vs Jacobs Engineering Group Inc.