| __timestamp | IDEX Corporation | Union Pacific Corporation |
|---|---|---|
| Wednesday, January 1, 2014 | 1198452000 | 14311000000 |
| Thursday, January 1, 2015 | 1116353000 | 12837000000 |
| Friday, January 1, 2016 | 1182276000 | 11672000000 |
| Sunday, January 1, 2017 | 1260634000 | 12231000000 |
| Monday, January 1, 2018 | 1365771000 | 13293000000 |
| Tuesday, January 1, 2019 | 1369539000 | 12094000000 |
| Wednesday, January 1, 2020 | 1324222000 | 10354000000 |
| Friday, January 1, 2021 | 1540300000 | 11290000000 |
| Saturday, January 1, 2022 | 1755000000 | 13670000000 |
| Sunday, January 1, 2023 | 1825400000 | 13590000000 |
| Monday, January 1, 2024 | 1814000000 | 13211000000 |
Igniting the spark of knowledge
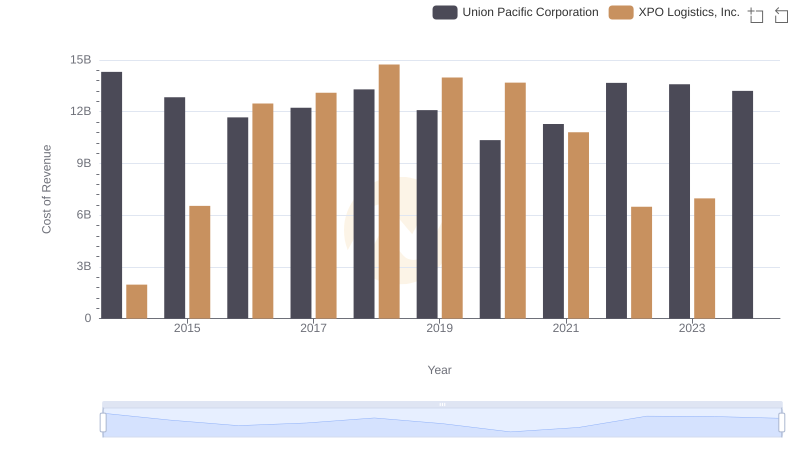
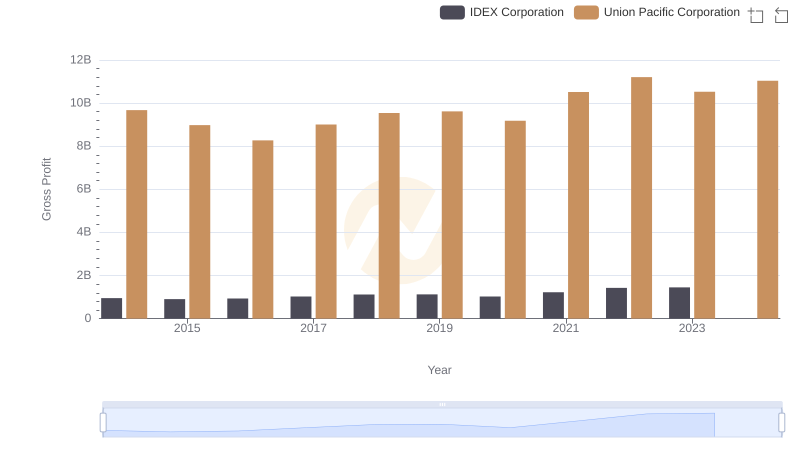
In the world of industrial giants, Union Pacific Corporation and IDEX Corporation stand as titans in their respective fields. Over the past decade, from 2014 to 2023, these companies have showcased contrasting trends in their cost of revenue. Union Pacific, a leader in the railroad industry, consistently reported higher costs, peaking in 2014 with a staggering 14.3 billion. However, by 2023, this figure had decreased by approximately 5%, reflecting strategic cost management.
IDEX Corporation, a diversified industrial manufacturer, displayed a different trajectory. Starting at 1.2 billion in 2014, their cost of revenue rose by over 50% to reach 1.8 billion in 2023. This increase highlights IDEX's expansion and investment in growth. Notably, 2024 data for IDEX is missing, leaving room for speculation on future trends.
These insights offer a glimpse into the financial strategies of two industry leaders, each navigating their unique challenges and opportunities.