| __timestamp | Booz Allen Hamilton Holding Corporation | Union Pacific Corporation |
|---|---|---|
| Wednesday, January 1, 2014 | 2716113000 | 14311000000 |
| Thursday, January 1, 2015 | 2593849000 | 12837000000 |
| Friday, January 1, 2016 | 2580026000 | 11672000000 |
| Sunday, January 1, 2017 | 2691982000 | 12231000000 |
| Monday, January 1, 2018 | 2867103000 | 13293000000 |
| Tuesday, January 1, 2019 | 3100466000 | 12094000000 |
| Wednesday, January 1, 2020 | 3379180000 | 10354000000 |
| Friday, January 1, 2021 | 3657530000 | 11290000000 |
| Saturday, January 1, 2022 | 3899622000 | 13670000000 |
| Sunday, January 1, 2023 | 4304810000 | 13590000000 |
| Monday, January 1, 2024 | 8202847000 | 13211000000 |
Infusing magic into the data realm
In the world of corporate finance, understanding the cost of revenue is crucial for evaluating a company's efficiency and profitability. This chart offers a fascinating comparison between Union Pacific Corporation and Booz Allen Hamilton Holding Corporation from 2014 to 2024.
Union Pacific, a titan in the transportation sector, has maintained a relatively stable cost of revenue over the years. Despite a slight dip in 2020, the company rebounded, showcasing a consistent trend with costs hovering around 13 billion annually.
In contrast, Booz Allen Hamilton, a leader in management consulting, experienced a dramatic increase in its cost of revenue, particularly in 2024, where it surged by over 90% compared to 2014. This growth reflects the company's expanding operations and market reach.
This comparison highlights the diverse strategies and market dynamics faced by companies in different sectors.
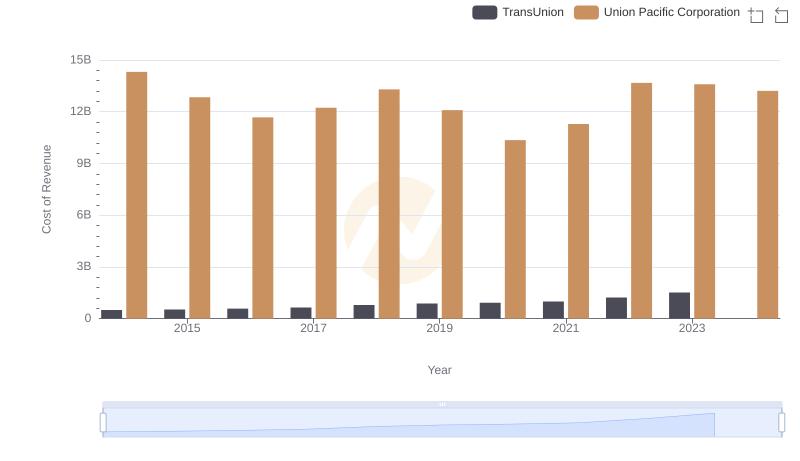
Union Pacific Corporation vs TransUnion: Efficiency in Cost of Revenue Explored
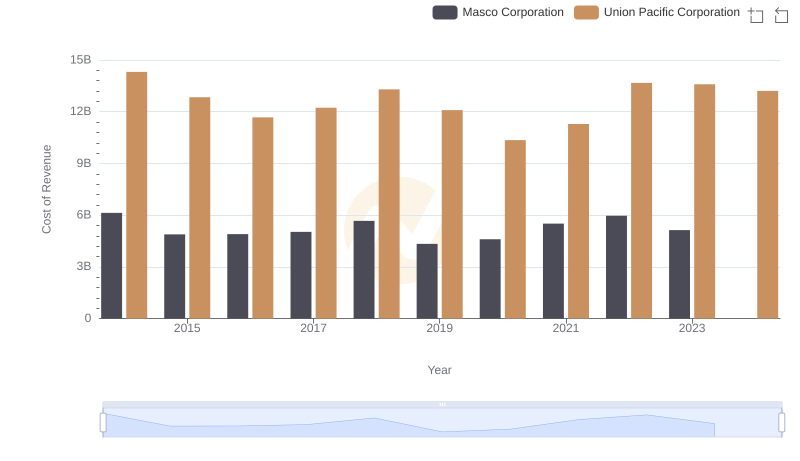
Cost of Revenue Trends: Union Pacific Corporation vs Masco Corporation
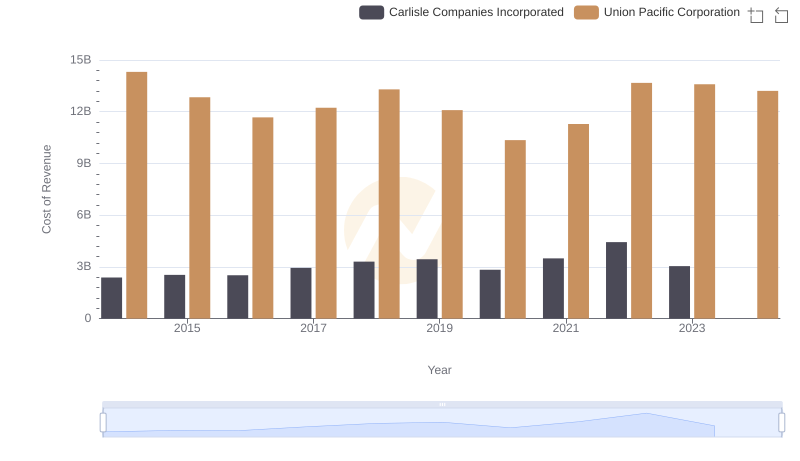
Cost of Revenue Trends: Union Pacific Corporation vs Carlisle Companies Incorporated
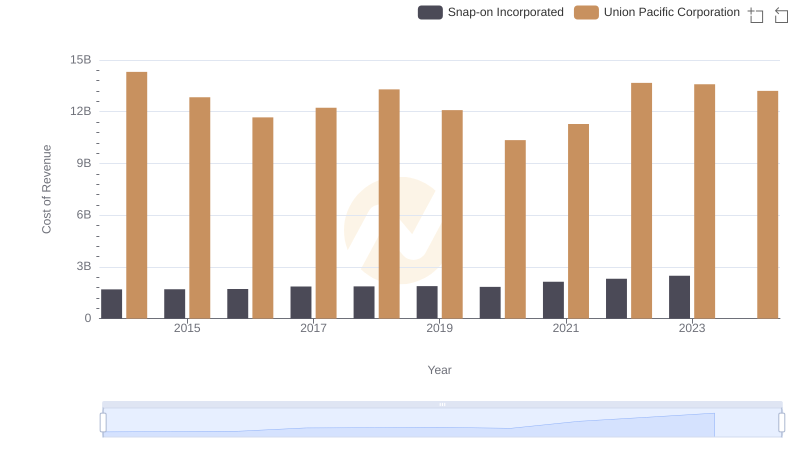
Cost of Revenue Trends: Union Pacific Corporation vs Snap-on Incorporated
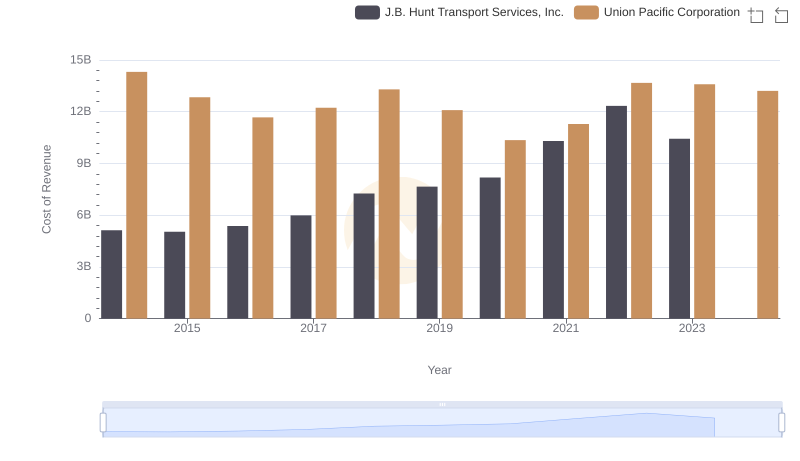
Analyzing Cost of Revenue: Union Pacific Corporation and J.B. Hunt Transport Services, Inc.
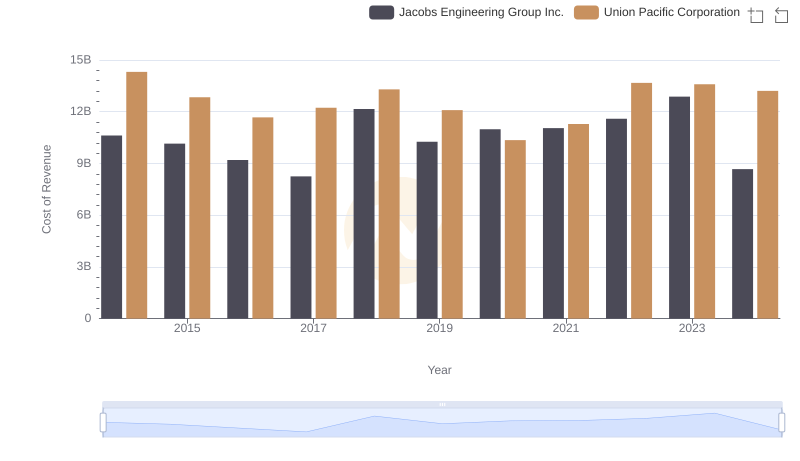
Cost of Revenue Trends: Union Pacific Corporation vs Jacobs Engineering Group Inc.
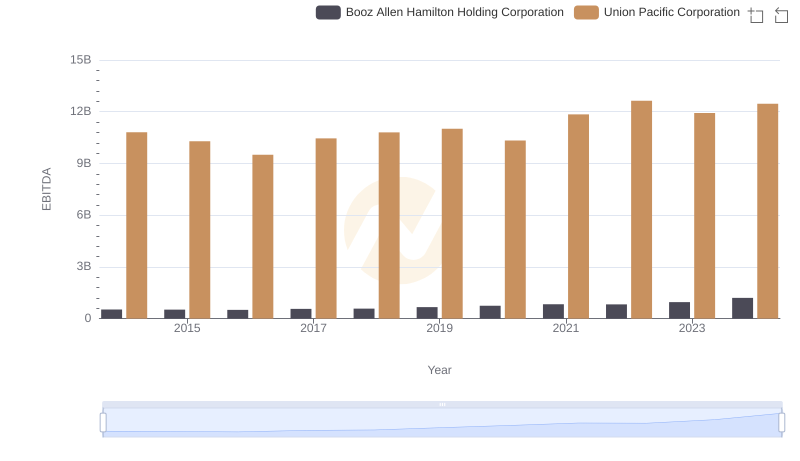
A Side-by-Side Analysis of EBITDA: Union Pacific Corporation and Booz Allen Hamilton Holding Corporation