| __timestamp | Masco Corporation | Union Pacific Corporation |
|---|---|---|
| Wednesday, January 1, 2014 | 6134000000 | 14311000000 |
| Thursday, January 1, 2015 | 4889000000 | 12837000000 |
| Friday, January 1, 2016 | 4901000000 | 11672000000 |
| Sunday, January 1, 2017 | 5033000000 | 12231000000 |
| Monday, January 1, 2018 | 5670000000 | 13293000000 |
| Tuesday, January 1, 2019 | 4336000000 | 12094000000 |
| Wednesday, January 1, 2020 | 4601000000 | 10354000000 |
| Friday, January 1, 2021 | 5512000000 | 11290000000 |
| Saturday, January 1, 2022 | 5967000000 | 13670000000 |
| Sunday, January 1, 2023 | 5131000000 | 13590000000 |
| Monday, January 1, 2024 | 4997000000 | 13211000000 |
Infusing magic into the data realm
In the ever-evolving landscape of American industry, understanding cost dynamics is crucial. Union Pacific Corporation, a titan in the railroad sector, and Masco Corporation, a leader in home improvement and building products, offer a fascinating study in contrasts. From 2014 to 2023, Union Pacific's cost of revenue has shown a steady trajectory, peaking in 2014 and 2022, with a notable dip in 2020, reflecting broader economic challenges. Meanwhile, Masco's cost of revenue has fluctuated more dramatically, with a significant drop in 2019 and a resurgence in 2022. This divergence highlights the distinct operational challenges and market conditions each company faces. Notably, 2024 data for Masco is missing, leaving room for speculation on future trends. This analysis underscores the importance of strategic cost management in maintaining competitive advantage.
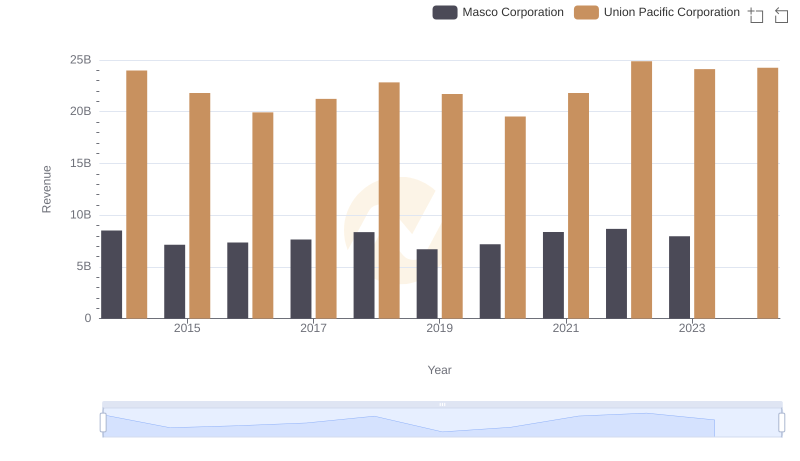
Annual Revenue Comparison: Union Pacific Corporation vs Masco Corporation
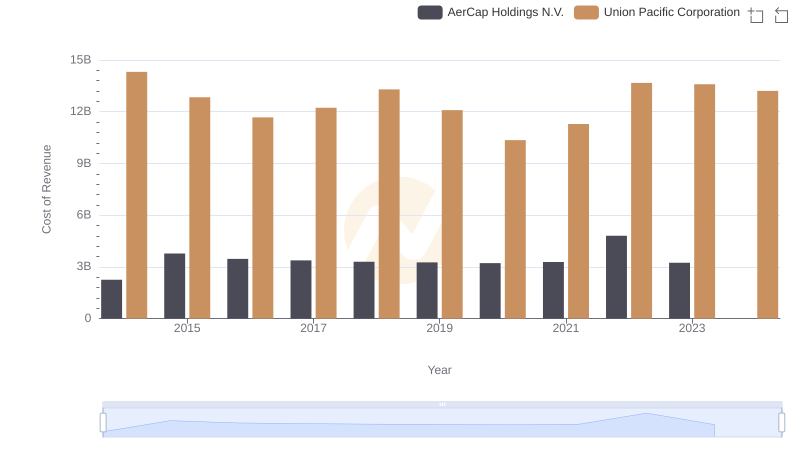
Analyzing Cost of Revenue: Union Pacific Corporation and AerCap Holdings N.V.
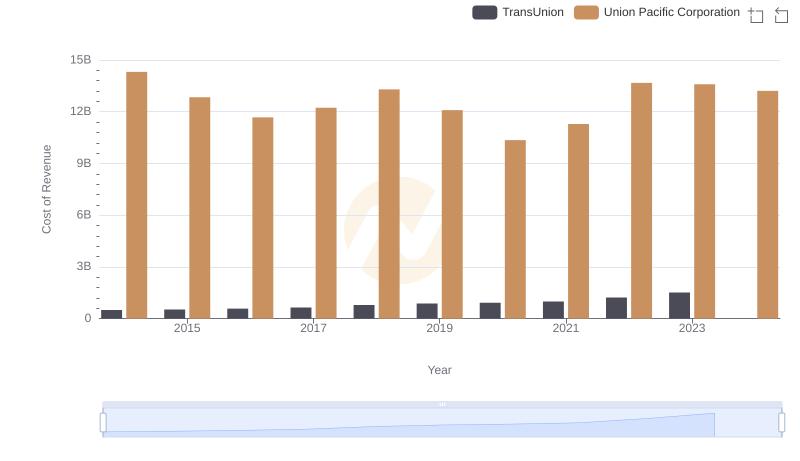
Union Pacific Corporation vs TransUnion: Efficiency in Cost of Revenue Explored
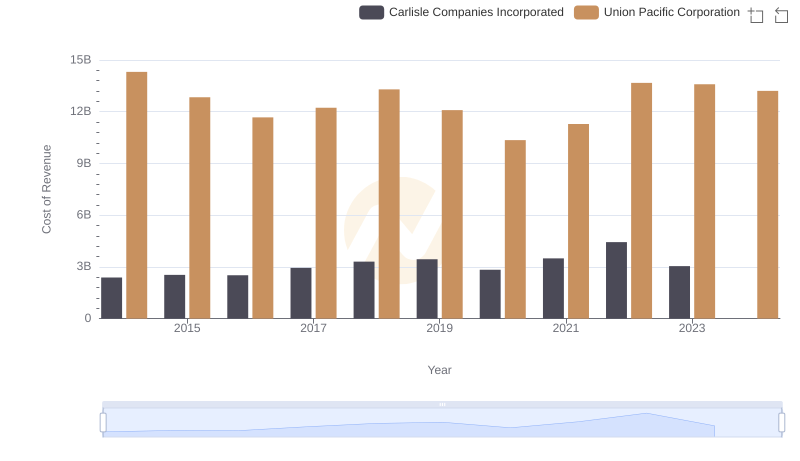
Cost of Revenue Trends: Union Pacific Corporation vs Carlisle Companies Incorporated
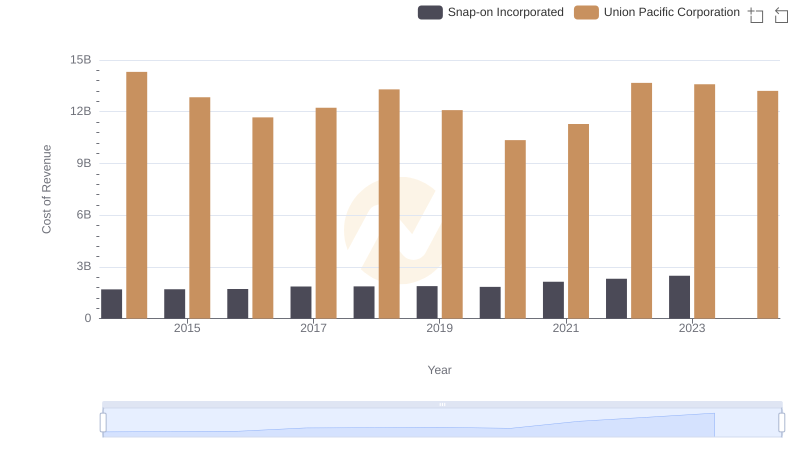
Cost of Revenue Trends: Union Pacific Corporation vs Snap-on Incorporated
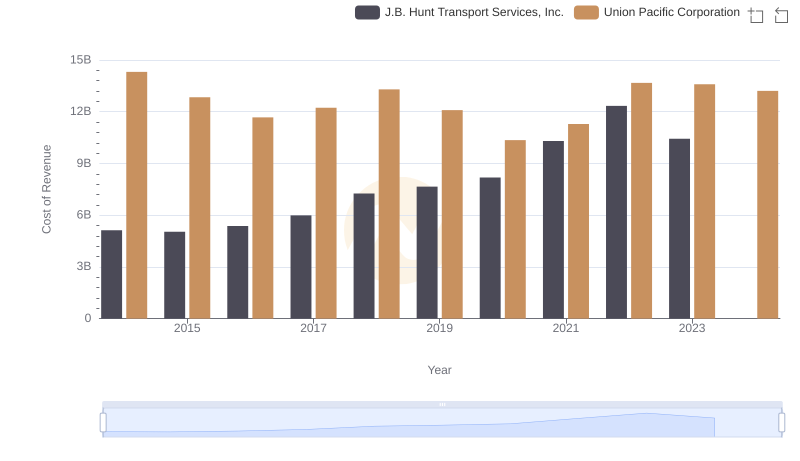
Analyzing Cost of Revenue: Union Pacific Corporation and J.B. Hunt Transport Services, Inc.
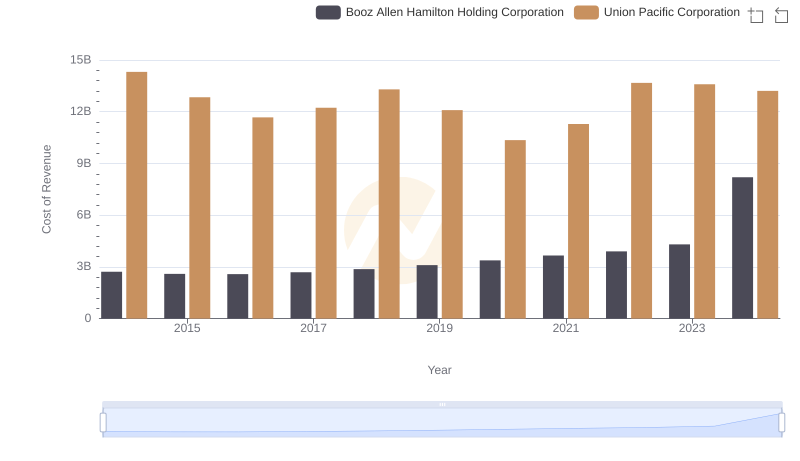
Cost of Revenue Comparison: Union Pacific Corporation vs Booz Allen Hamilton Holding Corporation
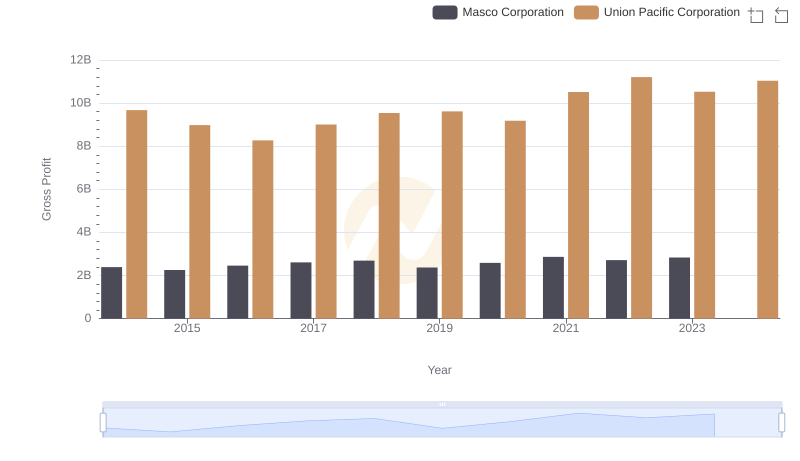
Union Pacific Corporation and Masco Corporation: A Detailed Gross Profit Analysis
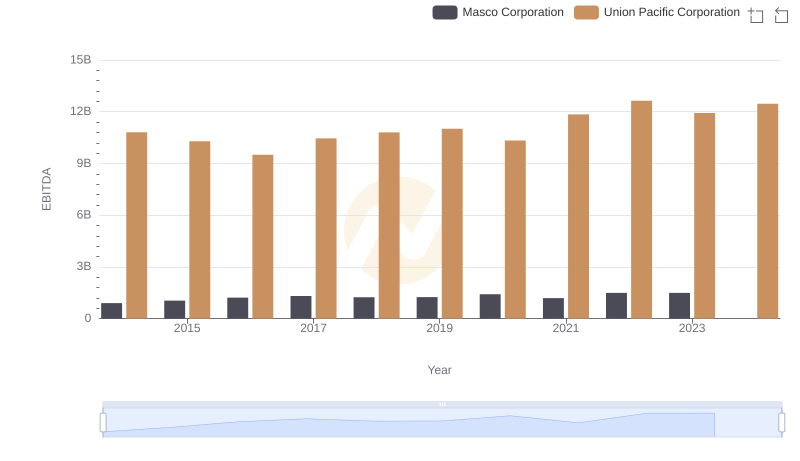
A Professional Review of EBITDA: Union Pacific Corporation Compared to Masco Corporation