| __timestamp | Union Pacific Corporation | XPO Logistics, Inc. |
|---|---|---|
| Wednesday, January 1, 2014 | 14311000000 | 1975000000 |
| Thursday, January 1, 2015 | 12837000000 | 6538400000 |
| Friday, January 1, 2016 | 11672000000 | 12480100000 |
| Sunday, January 1, 2017 | 12231000000 | 13101100000 |
| Monday, January 1, 2018 | 13293000000 | 14738000000 |
| Tuesday, January 1, 2019 | 12094000000 | 13982000000 |
| Wednesday, January 1, 2020 | 10354000000 | 13689000000 |
| Friday, January 1, 2021 | 11290000000 | 10812000000 |
| Saturday, January 1, 2022 | 13670000000 | 6491000000 |
| Sunday, January 1, 2023 | 13590000000 | 6974000000 |
| Monday, January 1, 2024 | 13211000000 | 7157000000 |
Unlocking the unknown
In the ever-evolving landscape of logistics and transportation, cost efficiency remains a pivotal factor for success. Over the past decade, Union Pacific Corporation and XPO Logistics, Inc. have showcased contrasting trajectories in their cost of revenue. Union Pacific, a stalwart in the rail industry, has consistently maintained a cost of revenue around $12.6 billion, with a notable dip in 2020. Meanwhile, XPO Logistics, a leader in supply chain solutions, saw its cost of revenue peak in 2018 at approximately $14.7 billion, before experiencing a significant decline by 2022.
From 2014 to 2023, Union Pacific's cost efficiency improved by roughly 5%, while XPO's fluctuated, reflecting its dynamic business model. This comparison highlights the strategic differences between a traditional rail giant and a modern logistics innovator. As we look to the future, understanding these trends offers valuable insights into the operational strategies of these industry leaders.
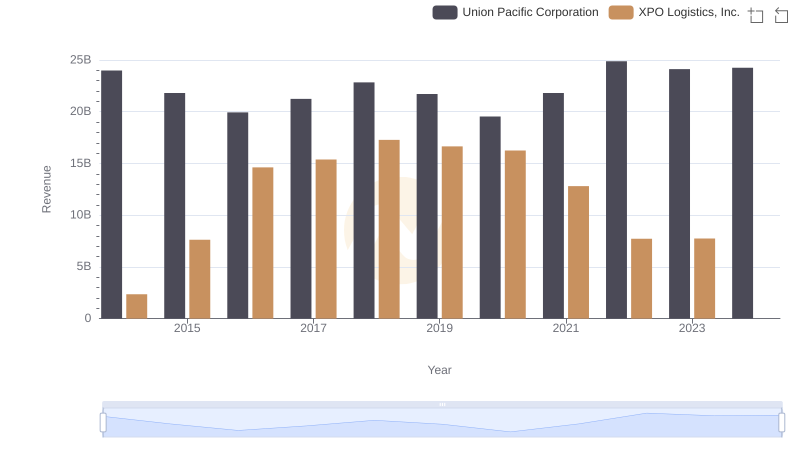
Annual Revenue Comparison: Union Pacific Corporation vs XPO Logistics, Inc.
Cost of Revenue Comparison: Union Pacific Corporation vs IDEX Corporation

Cost of Revenue: Key Insights for Union Pacific Corporation and Graco Inc.
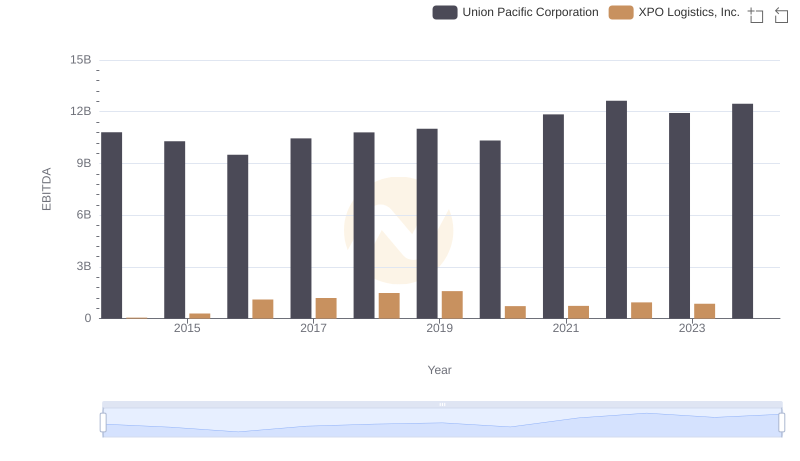
A Professional Review of EBITDA: Union Pacific Corporation Compared to XPO Logistics, Inc.