| __timestamp | Carlisle Companies Incorporated | Union Pacific Corporation |
|---|---|---|
| Wednesday, January 1, 2014 | 2384500000 | 14311000000 |
| Thursday, January 1, 2015 | 2536500000 | 12837000000 |
| Friday, January 1, 2016 | 2518100000 | 11672000000 |
| Sunday, January 1, 2017 | 2941900000 | 12231000000 |
| Monday, January 1, 2018 | 3304800000 | 13293000000 |
| Tuesday, January 1, 2019 | 3439900000 | 12094000000 |
| Wednesday, January 1, 2020 | 2832500000 | 10354000000 |
| Friday, January 1, 2021 | 3495600000 | 11290000000 |
| Saturday, January 1, 2022 | 4434500000 | 13670000000 |
| Sunday, January 1, 2023 | 3042900000 | 13590000000 |
| Monday, January 1, 2024 | 3115900000 | 13211000000 |
Unleashing the power of data
In the ever-evolving landscape of American industry, Union Pacific Corporation and Carlisle Companies Incorporated stand as titans in their respective fields. Over the past decade, these companies have navigated the turbulent waters of economic change, with their cost of revenue reflecting their strategic maneuvers.
From 2014 to 2023, Union Pacific's cost of revenue has seen a notable decline of approximately 5%, from its peak in 2014 to 2023. This trend highlights the company's efficiency improvements and cost management strategies. In contrast, Carlisle Companies experienced a 28% increase in their cost of revenue, peaking in 2022, before a slight dip in 2023. This surge underscores Carlisle's aggressive expansion and investment in growth opportunities.
As we look to the future, the missing data for 2024 leaves us anticipating how these industry leaders will adapt to the ever-changing economic landscape.
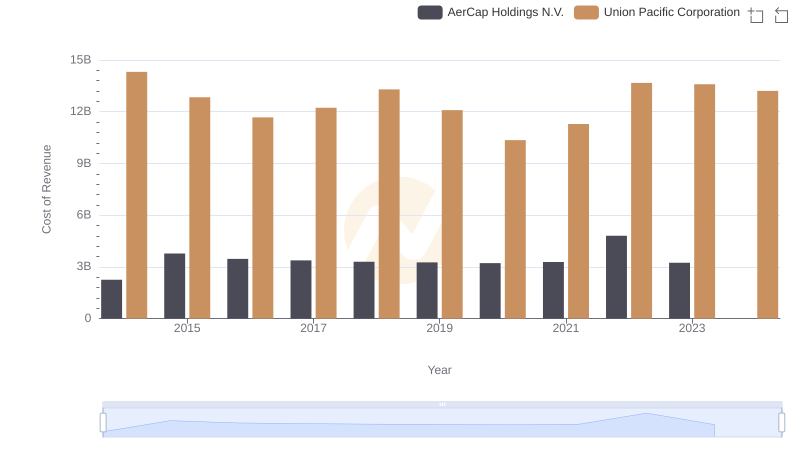
Analyzing Cost of Revenue: Union Pacific Corporation and AerCap Holdings N.V.
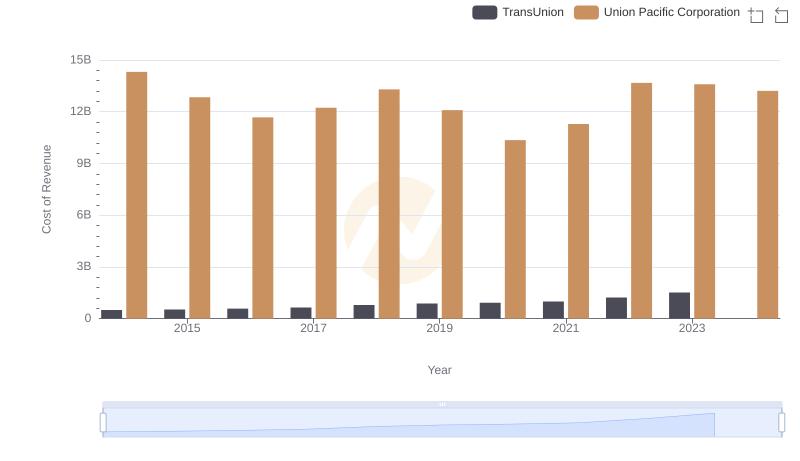
Union Pacific Corporation vs TransUnion: Efficiency in Cost of Revenue Explored
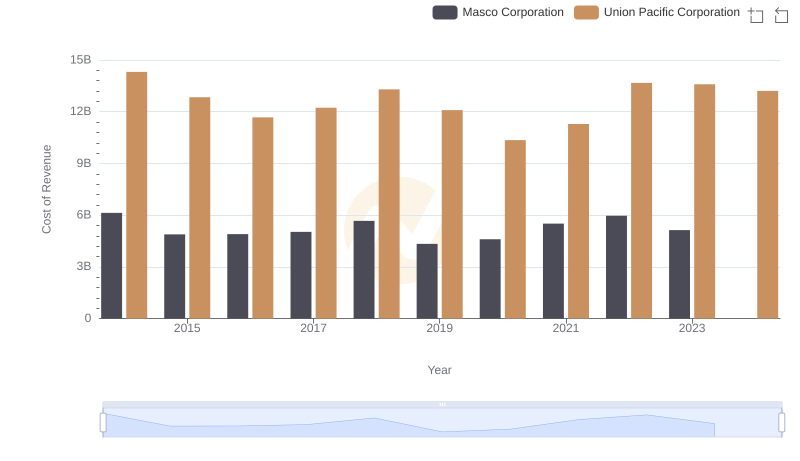
Cost of Revenue Trends: Union Pacific Corporation vs Masco Corporation
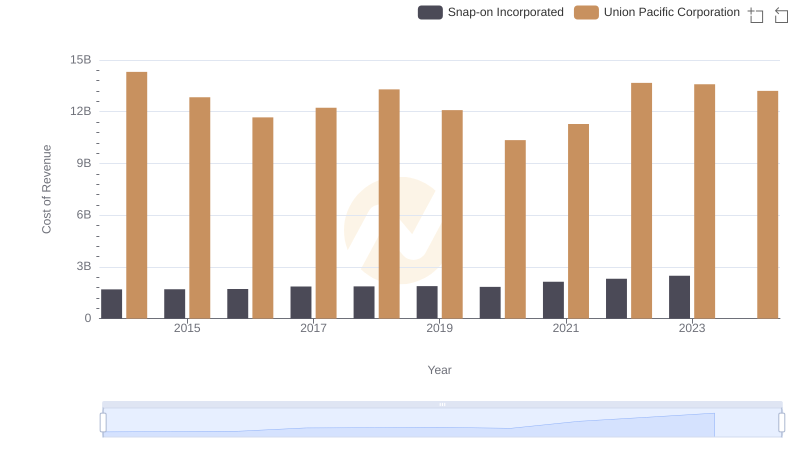
Cost of Revenue Trends: Union Pacific Corporation vs Snap-on Incorporated
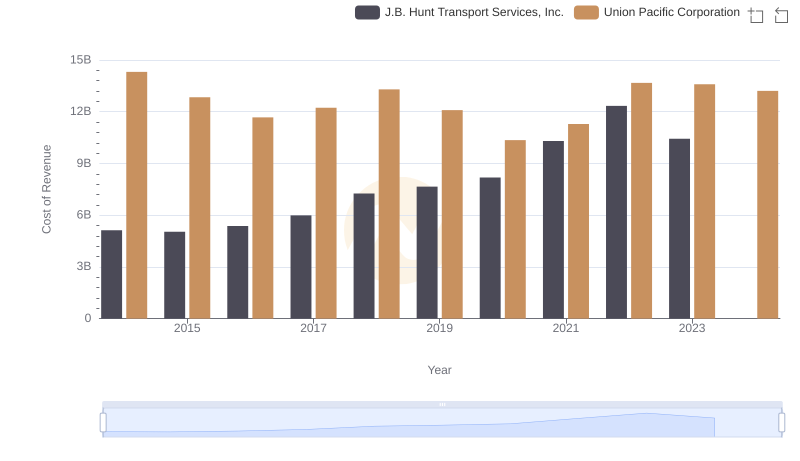
Analyzing Cost of Revenue: Union Pacific Corporation and J.B. Hunt Transport Services, Inc.
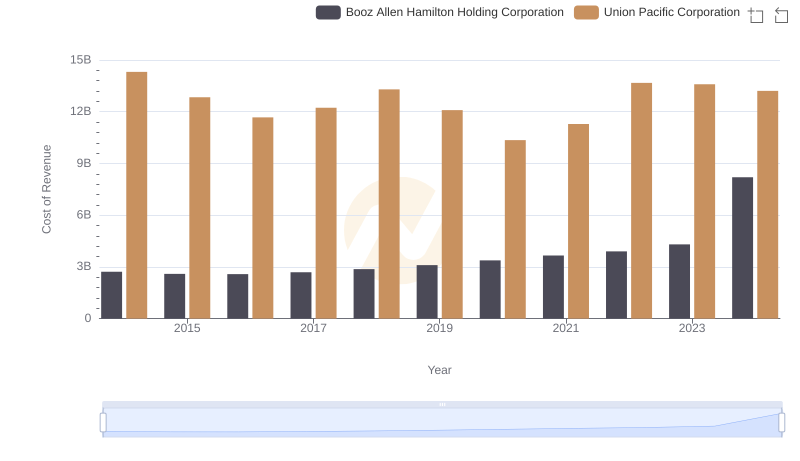
Cost of Revenue Comparison: Union Pacific Corporation vs Booz Allen Hamilton Holding Corporation
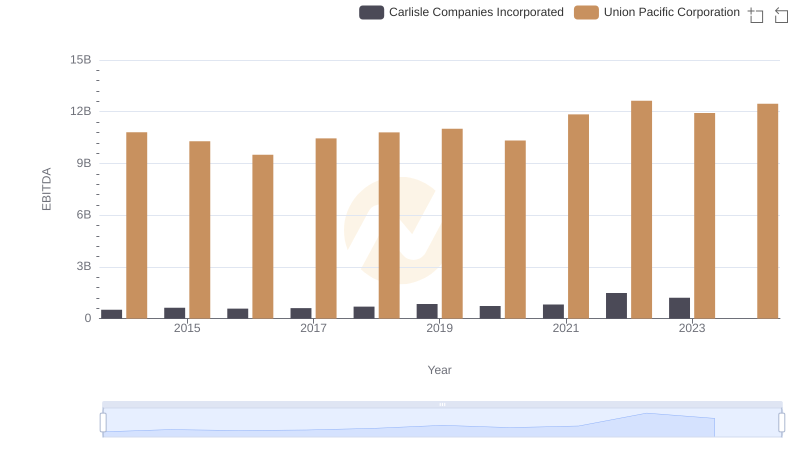
A Side-by-Side Analysis of EBITDA: Union Pacific Corporation and Carlisle Companies Incorporated