| __timestamp | J.B. Hunt Transport Services, Inc. | Union Pacific Corporation |
|---|---|---|
| Wednesday, January 1, 2014 | 5124095000 | 14311000000 |
| Thursday, January 1, 2015 | 5041472000 | 12837000000 |
| Friday, January 1, 2016 | 5369826000 | 11672000000 |
| Sunday, January 1, 2017 | 5990275000 | 12231000000 |
| Monday, January 1, 2018 | 7255657000 | 13293000000 |
| Tuesday, January 1, 2019 | 7659003000 | 12094000000 |
| Wednesday, January 1, 2020 | 8186697000 | 10354000000 |
| Friday, January 1, 2021 | 10298483000 | 11290000000 |
| Saturday, January 1, 2022 | 12341472000 | 13670000000 |
| Sunday, January 1, 2023 | 10433277000 | 13590000000 |
| Monday, January 1, 2024 | 13211000000 |
Unleashing the power of data
In the competitive landscape of American transportation, Union Pacific Corporation and J.B. Hunt Transport Services, Inc. stand as titans. Over the past decade, these companies have navigated the complexities of cost management with varying strategies. From 2014 to 2023, Union Pacific's cost of revenue has shown a steady trend, peaking in 2014 and 2022, with a slight dip in 2020. Meanwhile, J.B. Hunt's cost of revenue surged by approximately 140% from 2014 to 2022, reflecting its aggressive expansion and adaptation to market demands. Notably, 2023 saw a decline in J.B. Hunt's cost, possibly indicating strategic cost-cutting measures. Missing data for 2024 suggests a need for cautious interpretation. This analysis provides a window into the operational efficiencies and challenges faced by these industry leaders, offering valuable insights for investors and stakeholders alike.
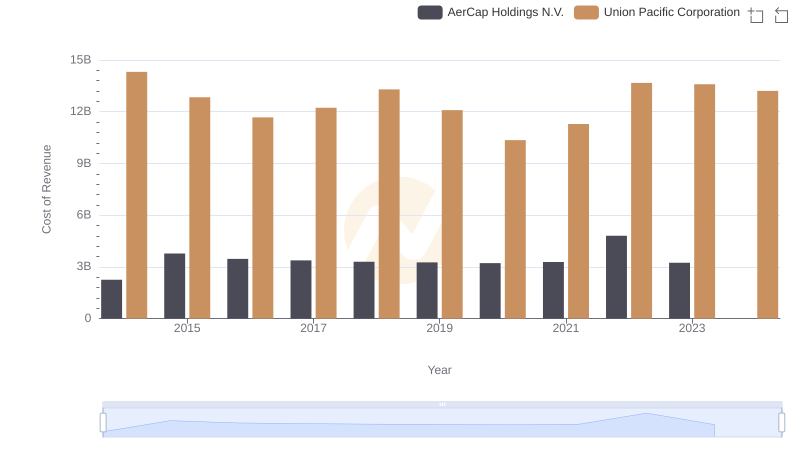
Analyzing Cost of Revenue: Union Pacific Corporation and AerCap Holdings N.V.
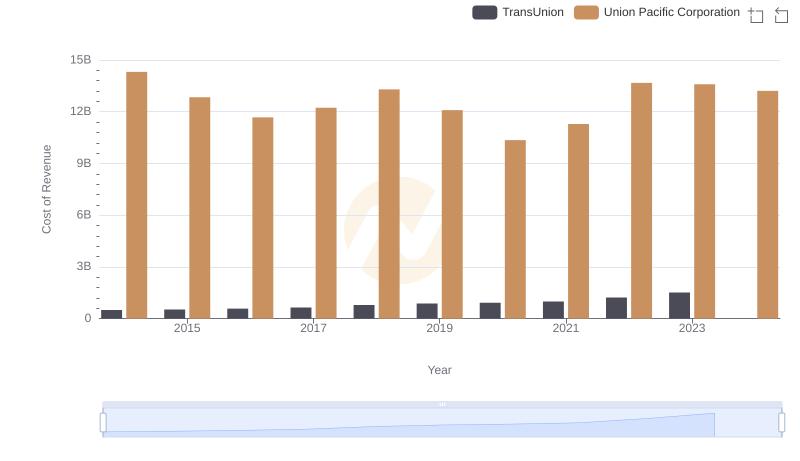
Union Pacific Corporation vs TransUnion: Efficiency in Cost of Revenue Explored
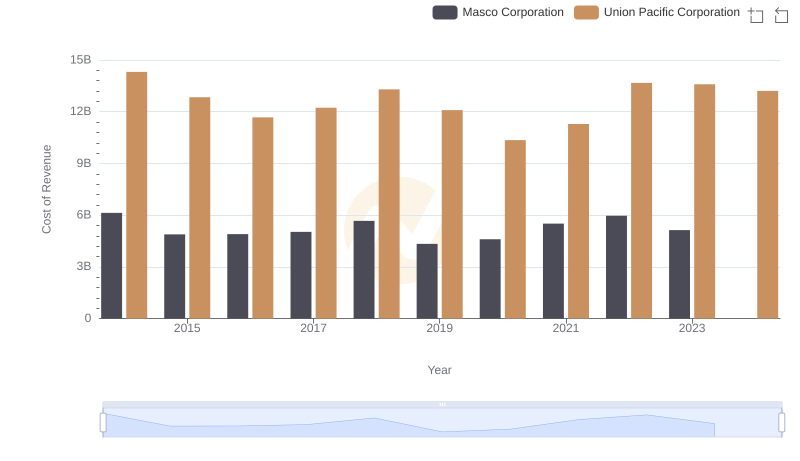
Cost of Revenue Trends: Union Pacific Corporation vs Masco Corporation
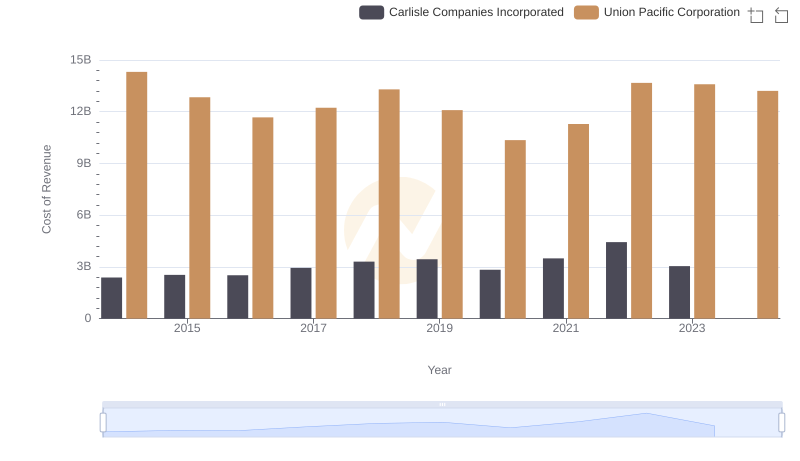
Cost of Revenue Trends: Union Pacific Corporation vs Carlisle Companies Incorporated
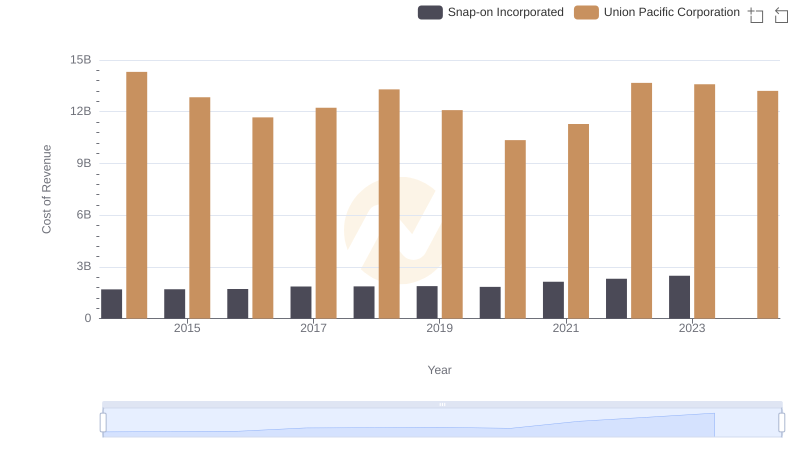
Cost of Revenue Trends: Union Pacific Corporation vs Snap-on Incorporated
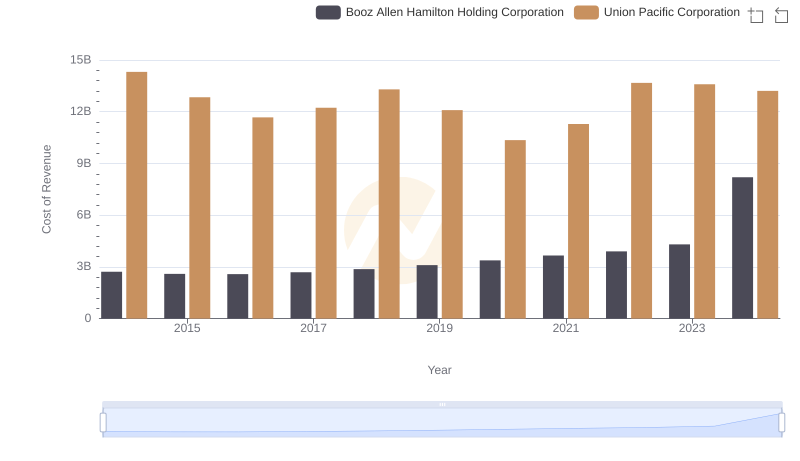
Cost of Revenue Comparison: Union Pacific Corporation vs Booz Allen Hamilton Holding Corporation
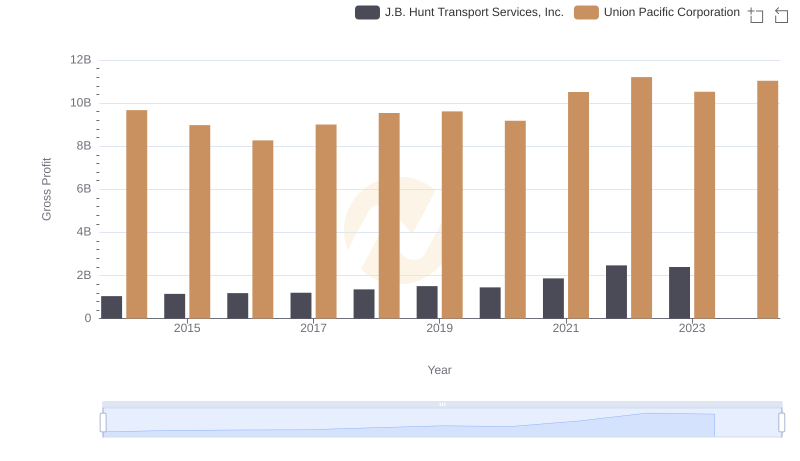
Who Generates Higher Gross Profit? Union Pacific Corporation or J.B. Hunt Transport Services, Inc.
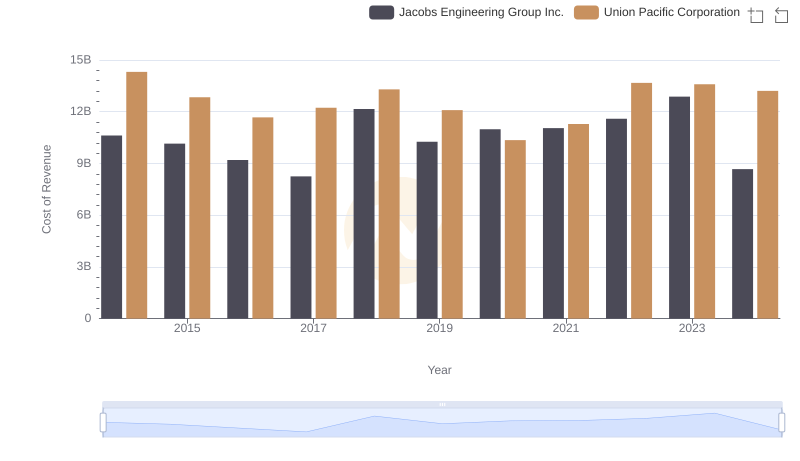
Cost of Revenue Trends: Union Pacific Corporation vs Jacobs Engineering Group Inc.