| __timestamp | The Boeing Company | Waste Connections, Inc. |
|---|---|---|
| Wednesday, January 1, 2014 | 76752000000 | 1138388000 |
| Thursday, January 1, 2015 | 82088000000 | 1177409000 |
| Friday, January 1, 2016 | 80790000000 | 1957712000 |
| Sunday, January 1, 2017 | 76066000000 | 2704775000 |
| Monday, January 1, 2018 | 81490000000 | 2865704000 |
| Tuesday, January 1, 2019 | 72093000000 | 3198757000 |
| Wednesday, January 1, 2020 | 63843000000 | 3276808000 |
| Friday, January 1, 2021 | 59237000000 | 3654074000 |
| Saturday, January 1, 2022 | 63078000000 | 4336012000 |
| Sunday, January 1, 2023 | 70070000000 | 4744513000 |
| Monday, January 1, 2024 | 68508000000 | 5191706000 |
Unveiling the hidden dimensions of data
In the ever-evolving landscape of American industry, the cost of revenue is a critical metric that reflects a company's operational efficiency. From 2014 to 2023, The Boeing Company and Waste Connections, Inc. have shown contrasting trends in their cost of revenue. Boeing, a titan in aerospace, saw its cost of revenue peak in 2015, followed by a gradual decline, hitting a low in 2021. This represents a 28% decrease from its 2015 peak, likely influenced by global economic shifts and industry-specific challenges.
Conversely, Waste Connections, a leader in waste management, experienced a steady increase, with its cost of revenue rising by over 300% from 2014 to 2023. This growth underscores the expanding demand for sustainable waste solutions. Notably, data for 2024 is incomplete, highlighting the dynamic nature of these industries. As these companies navigate future challenges, their cost of revenue will remain a key indicator of their strategic direction.

The Boeing Company and Waste Connections, Inc.: A Comprehensive Revenue Analysis
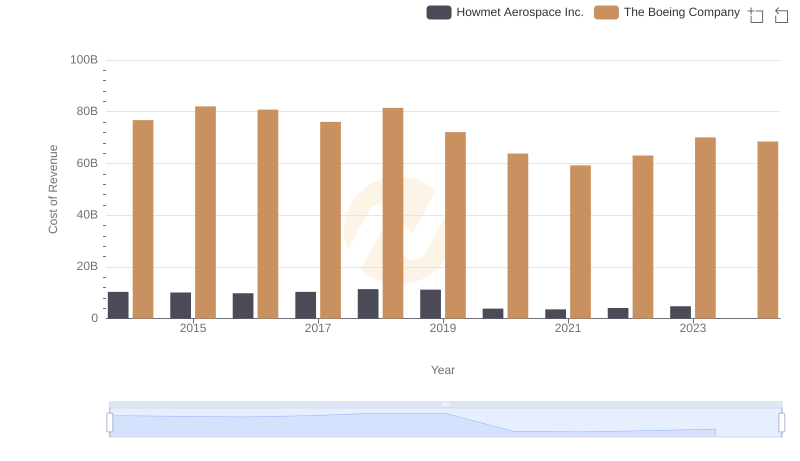
Analyzing Cost of Revenue: The Boeing Company and Howmet Aerospace Inc.
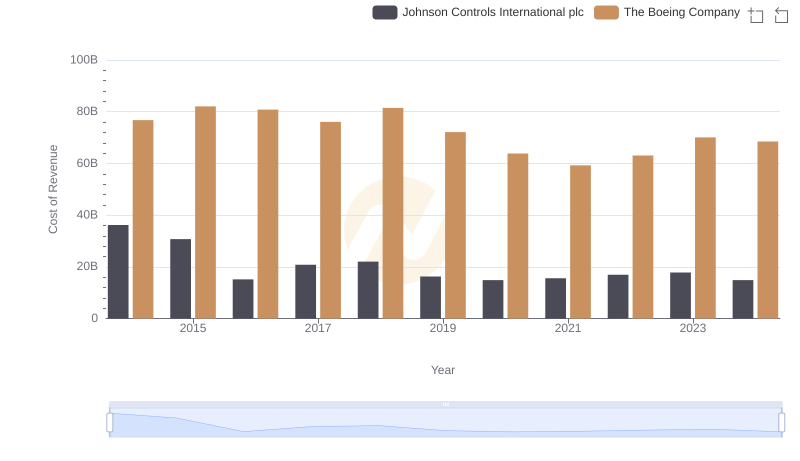
Analyzing Cost of Revenue: The Boeing Company and Johnson Controls International plc

Cost Insights: Breaking Down The Boeing Company and United Rentals, Inc.'s Expenses
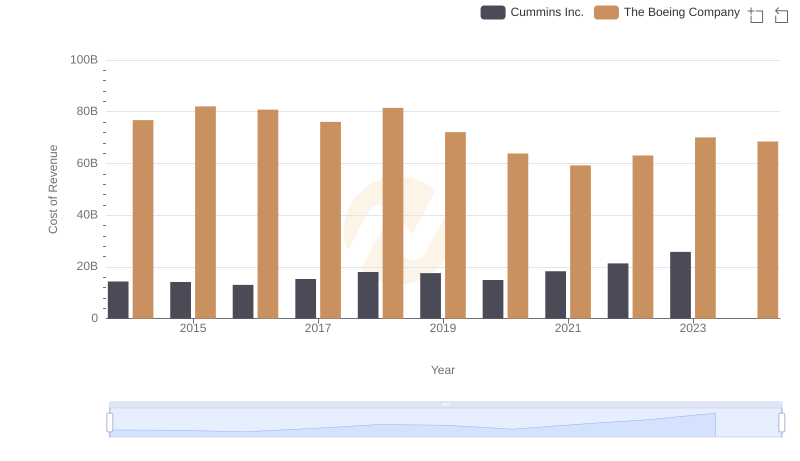
Cost of Revenue Comparison: The Boeing Company vs Cummins Inc.
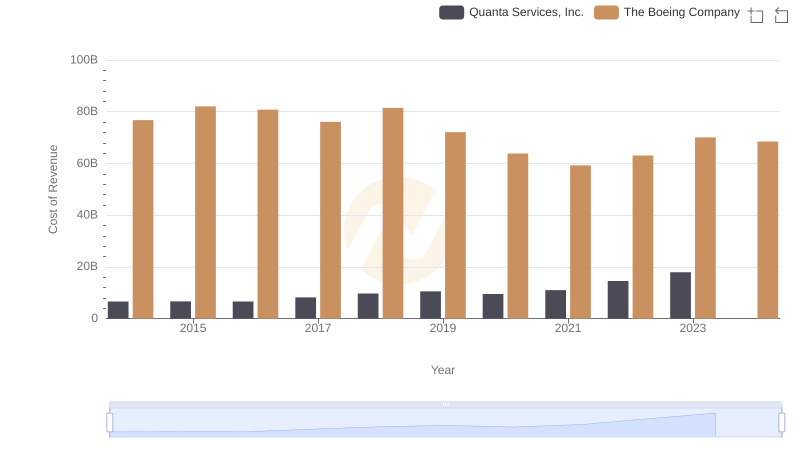
Cost Insights: Breaking Down The Boeing Company and Quanta Services, Inc.'s Expenses
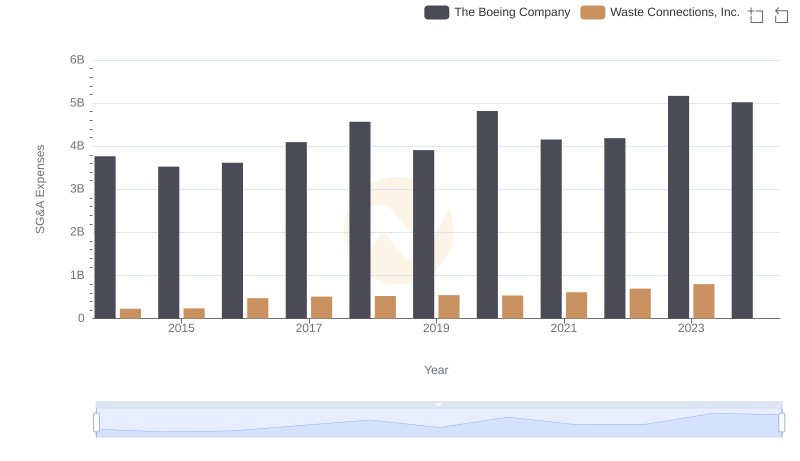
Who Optimizes SG&A Costs Better? The Boeing Company or Waste Connections, Inc.