| __timestamp | The Boeing Company | United Rentals, Inc. |
|---|---|---|
| Wednesday, January 1, 2014 | 76752000000 | 3253000000 |
| Thursday, January 1, 2015 | 82088000000 | 3337000000 |
| Friday, January 1, 2016 | 80790000000 | 3359000000 |
| Sunday, January 1, 2017 | 76066000000 | 3872000000 |
| Monday, January 1, 2018 | 81490000000 | 4683000000 |
| Tuesday, January 1, 2019 | 72093000000 | 5681000000 |
| Wednesday, January 1, 2020 | 63843000000 | 5347000000 |
| Friday, January 1, 2021 | 59237000000 | 5863000000 |
| Saturday, January 1, 2022 | 63078000000 | 6646000000 |
| Sunday, January 1, 2023 | 70070000000 | 8519000000 |
| Monday, January 1, 2024 | 68508000000 | 9195000000 |
Unveiling the hidden dimensions of data
In the ever-evolving landscape of corporate expenses, understanding cost dynamics is crucial. Over the past decade, The Boeing Company and United Rentals, Inc. have showcased distinct cost trajectories. Boeing's cost of revenue peaked in 2015, reaching approximately 82 billion, before experiencing a gradual decline, hitting a low in 2021. This represents a 28% decrease over six years, reflecting the challenges faced by the aerospace giant.
Conversely, United Rentals has seen a steady rise in its cost of revenue, with a notable 183% increase from 2014 to 2024. This growth underscores the company's expansion and increased operational scale. By 2024, United Rentals' cost of revenue is projected to be nearly 9.2 billion, highlighting its robust growth strategy.
These insights provide a window into the strategic shifts and market conditions influencing two major players in their respective industries.
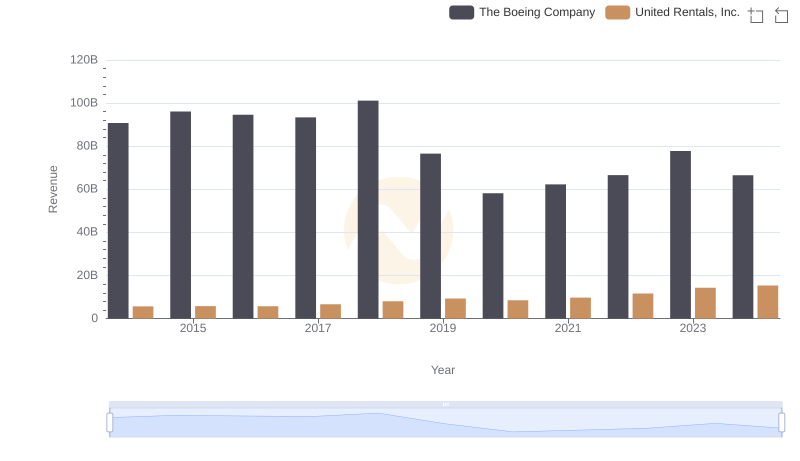
Revenue Insights: The Boeing Company and United Rentals, Inc. Performance Compared
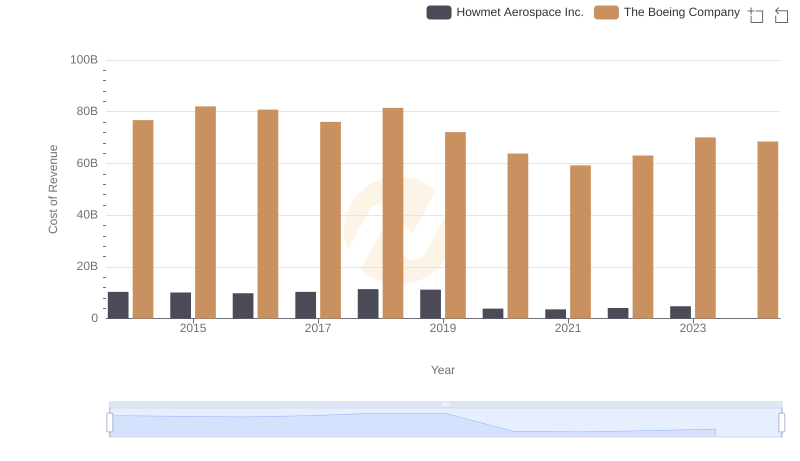
Analyzing Cost of Revenue: The Boeing Company and Howmet Aerospace Inc.
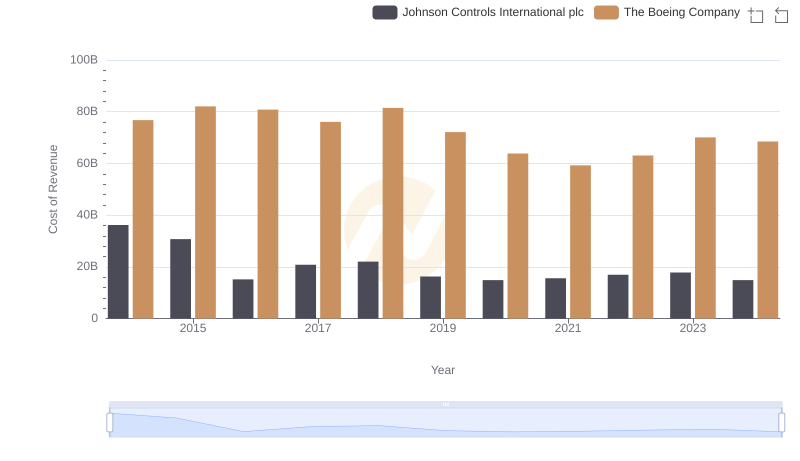
Analyzing Cost of Revenue: The Boeing Company and Johnson Controls International plc
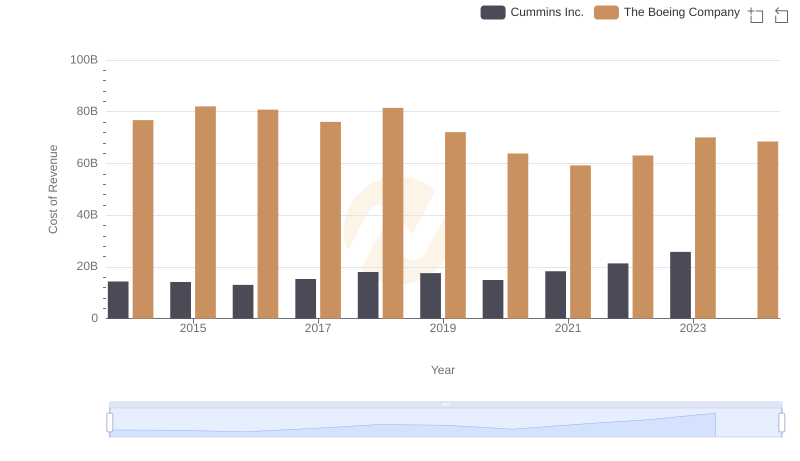
Cost of Revenue Comparison: The Boeing Company vs Cummins Inc.
Cost of Revenue Trends: The Boeing Company vs Waste Connections, Inc.
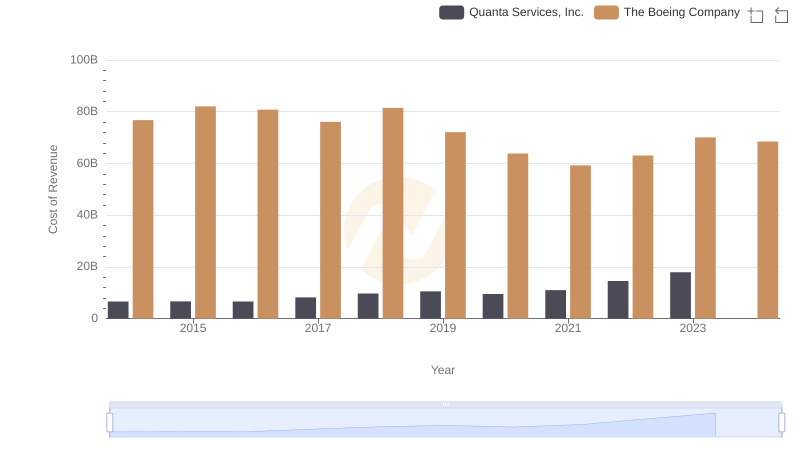
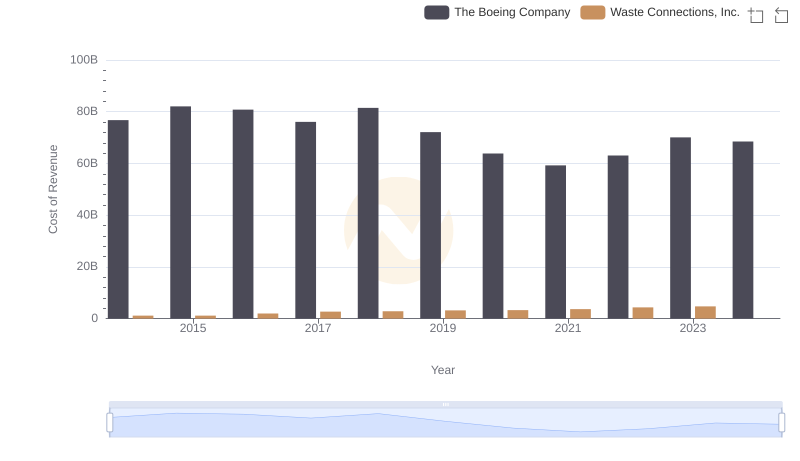
Cost Insights: Breaking Down The Boeing Company and Quanta Services, Inc.'s Expenses