| __timestamp | Howmet Aerospace Inc. | The Boeing Company |
|---|---|---|
| Wednesday, January 1, 2014 | 10349000000 | 76752000000 |
| Thursday, January 1, 2015 | 10104000000 | 82088000000 |
| Friday, January 1, 2016 | 9806000000 | 80790000000 |
| Sunday, January 1, 2017 | 10357000000 | 76066000000 |
| Monday, January 1, 2018 | 11397000000 | 81490000000 |
| Tuesday, January 1, 2019 | 11227000000 | 72093000000 |
| Wednesday, January 1, 2020 | 3878000000 | 63843000000 |
| Friday, January 1, 2021 | 3596000000 | 59237000000 |
| Saturday, January 1, 2022 | 4103000000 | 63078000000 |
| Sunday, January 1, 2023 | 4773000000 | 70070000000 |
| Monday, January 1, 2024 | 5119000000 | 68508000000 |
Data in motion
In the ever-evolving aerospace industry, understanding cost dynamics is crucial. This analysis delves into the cost of revenue trends for The Boeing Company and Howmet Aerospace Inc. from 2014 to 2023. Boeing, a titan in the aerospace sector, saw its cost of revenue peak in 2015, with a gradual decline of approximately 17% by 2023. Meanwhile, Howmet Aerospace, a key player in aerospace components, experienced a significant drop in 2020, with costs plummeting by over 60% compared to 2019, reflecting industry-wide challenges.
This data underscores the resilience and adaptability of these aerospace giants amidst global challenges.
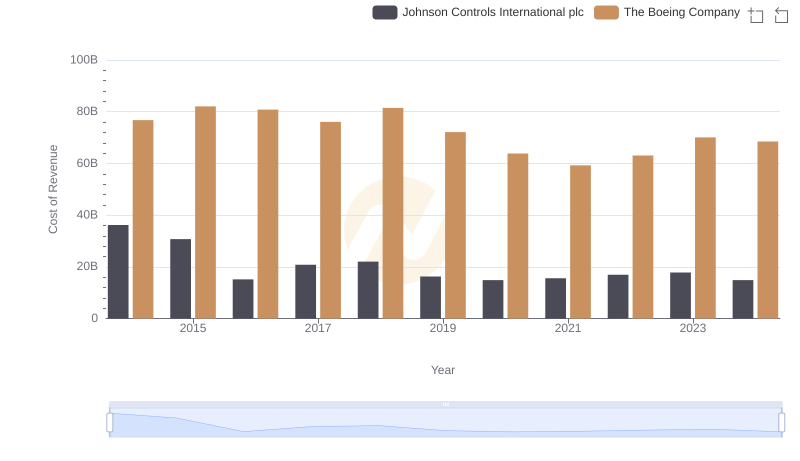
Analyzing Cost of Revenue: The Boeing Company and Johnson Controls International plc

Cost Insights: Breaking Down The Boeing Company and United Rentals, Inc.'s Expenses
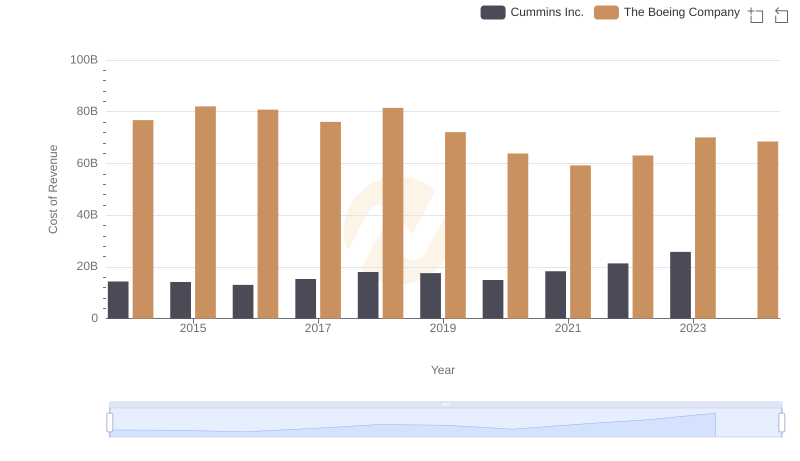
Cost of Revenue Comparison: The Boeing Company vs Cummins Inc.
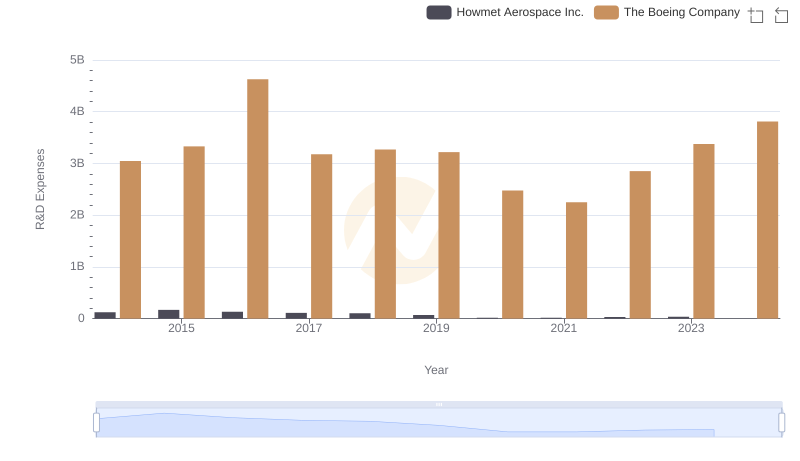
R&D Spending Showdown: The Boeing Company vs Howmet Aerospace Inc.
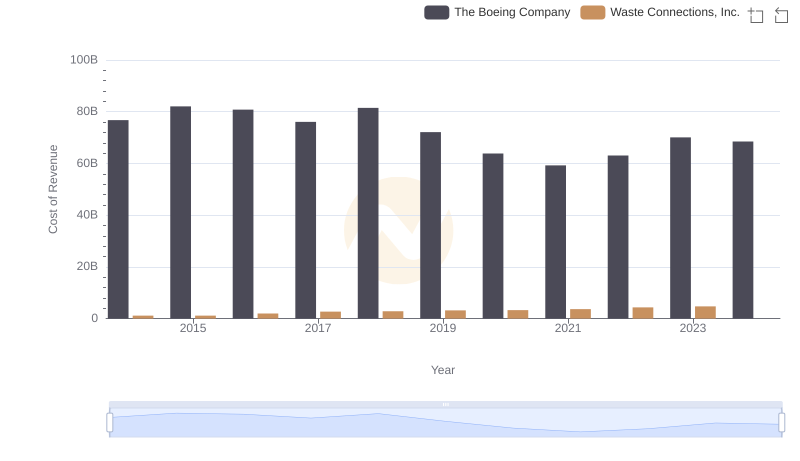
Cost of Revenue Trends: The Boeing Company vs Waste Connections, Inc.
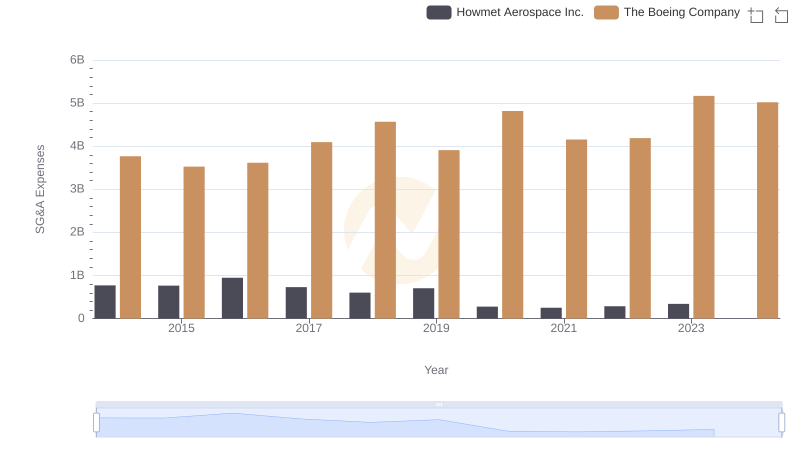
The Boeing Company or Howmet Aerospace Inc.: Who Manages SG&A Costs Better?