| __timestamp | Cummins Inc. | The Boeing Company |
|---|---|---|
| Wednesday, January 1, 2014 | 14360000000 | 76752000000 |
| Thursday, January 1, 2015 | 14163000000 | 82088000000 |
| Friday, January 1, 2016 | 13057000000 | 80790000000 |
| Sunday, January 1, 2017 | 15338000000 | 76066000000 |
| Monday, January 1, 2018 | 18034000000 | 81490000000 |
| Tuesday, January 1, 2019 | 17591000000 | 72093000000 |
| Wednesday, January 1, 2020 | 14917000000 | 63843000000 |
| Friday, January 1, 2021 | 18326000000 | 59237000000 |
| Saturday, January 1, 2022 | 21355000000 | 63078000000 |
| Sunday, January 1, 2023 | 25816000000 | 70070000000 |
| Monday, January 1, 2024 | 25663000000 | 68508000000 |
Data in motion
In the ever-evolving landscape of aerospace and automotive industries, understanding cost dynamics is crucial. From 2014 to 2023, The Boeing Company and Cummins Inc. have showcased contrasting trends in their cost of revenue. Boeing, a titan in aerospace, saw its cost of revenue peak in 2015, followed by a gradual decline, reaching its lowest in 2021. This represents a 28% decrease over the period, reflecting strategic cost management amidst industry challenges.
Conversely, Cummins, a leader in engine manufacturing, experienced a steady rise, with costs surging by 80% from 2014 to 2023. This growth underscores Cummins' expansion and increased production capabilities. Notably, 2024 data for Cummins is missing, leaving room for speculation on future trends. This comparison highlights the distinct financial strategies and market responses of these industry giants, offering valuable insights for investors and analysts alike.
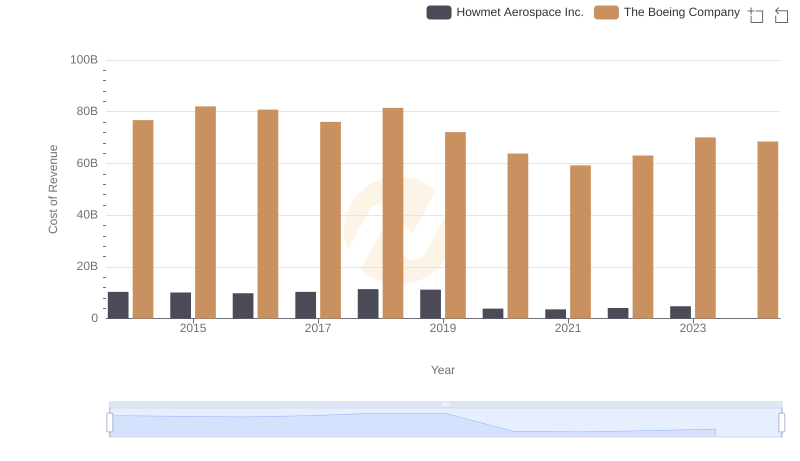
Analyzing Cost of Revenue: The Boeing Company and Howmet Aerospace Inc.
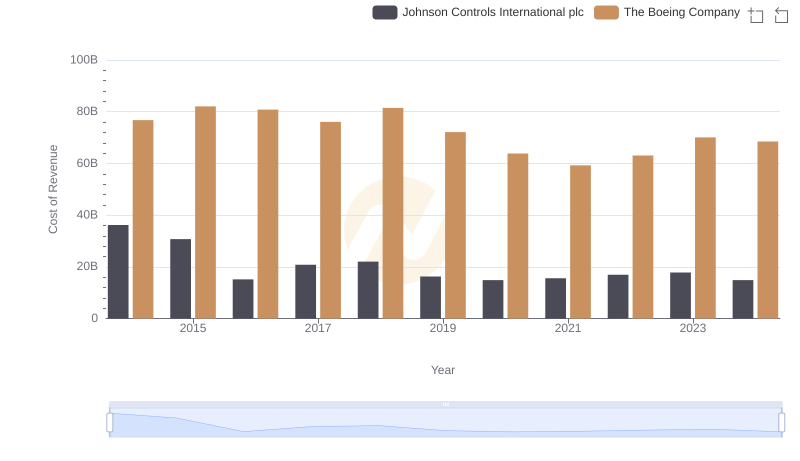
Analyzing Cost of Revenue: The Boeing Company and Johnson Controls International plc

Cost Insights: Breaking Down The Boeing Company and United Rentals, Inc.'s Expenses
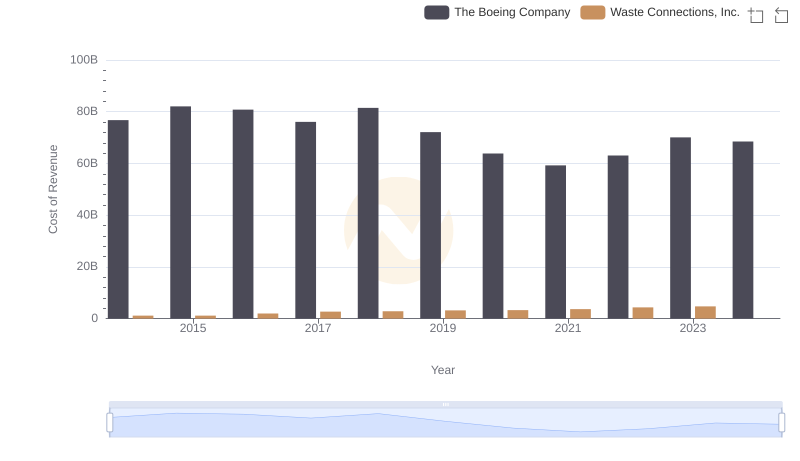
Cost of Revenue Trends: The Boeing Company vs Waste Connections, Inc.
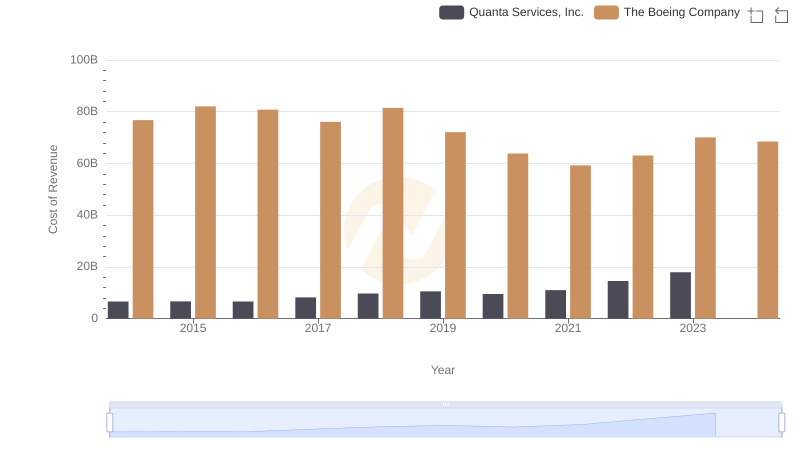
Cost Insights: Breaking Down The Boeing Company and Quanta Services, Inc.'s Expenses
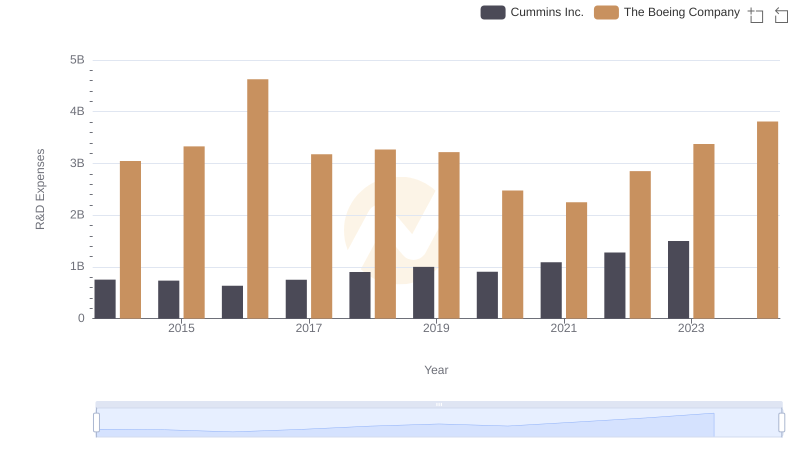
Who Prioritizes Innovation? R&D Spending Compared for The Boeing Company and Cummins Inc.