| __timestamp | Quanta Services, Inc. | The Boeing Company |
|---|---|---|
| Wednesday, January 1, 2014 | 6617730000 | 76752000000 |
| Thursday, January 1, 2015 | 6648771000 | 82088000000 |
| Friday, January 1, 2016 | 6637519000 | 80790000000 |
| Sunday, January 1, 2017 | 8224618000 | 76066000000 |
| Monday, January 1, 2018 | 9691459000 | 81490000000 |
| Tuesday, January 1, 2019 | 10511901000 | 72093000000 |
| Wednesday, January 1, 2020 | 9541825000 | 63843000000 |
| Friday, January 1, 2021 | 11026954000 | 59237000000 |
| Saturday, January 1, 2022 | 14544748000 | 63078000000 |
| Sunday, January 1, 2023 | 17945120000 | 70070000000 |
| Monday, January 1, 2024 | 68508000000 |
In pursuit of knowledge
In the ever-evolving landscape of aerospace and infrastructure, understanding cost dynamics is crucial. From 2014 to 2023, The Boeing Company and Quanta Services, Inc. have showcased intriguing trends in their cost of revenue. Boeing, a titan in aerospace, saw its cost of revenue peak in 2015, with a gradual decline of approximately 15% by 2021. This reflects the industry's challenges, including production halts and supply chain disruptions.
Conversely, Quanta Services, a leader in infrastructure solutions, experienced a robust growth trajectory. From 2014 to 2023, their cost of revenue surged by nearly 171%, highlighting their expansion and increased project undertakings. The data for 2024 remains incomplete, offering a glimpse into the uncertainties of future financial landscapes. These insights not only reveal the financial health of these giants but also underscore the broader economic shifts impacting their sectors.
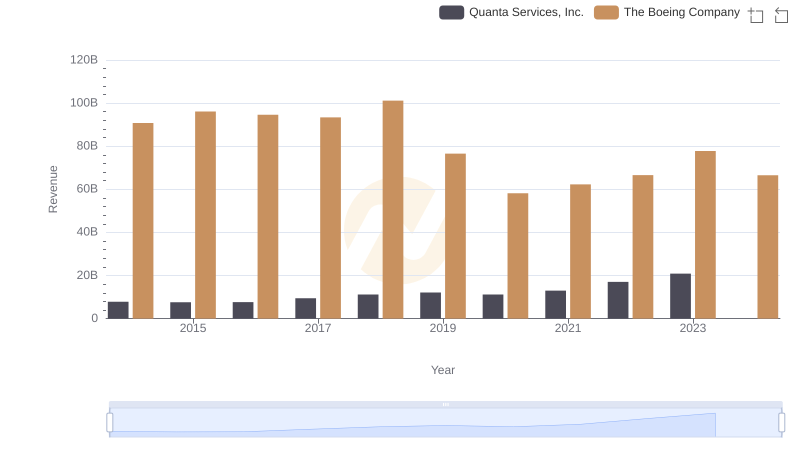
Breaking Down Revenue Trends: The Boeing Company vs Quanta Services, Inc.
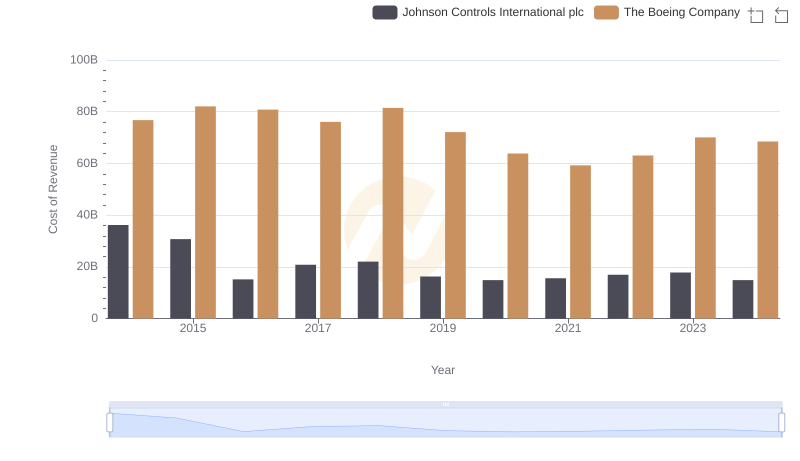
Analyzing Cost of Revenue: The Boeing Company and Johnson Controls International plc

Cost Insights: Breaking Down The Boeing Company and United Rentals, Inc.'s Expenses
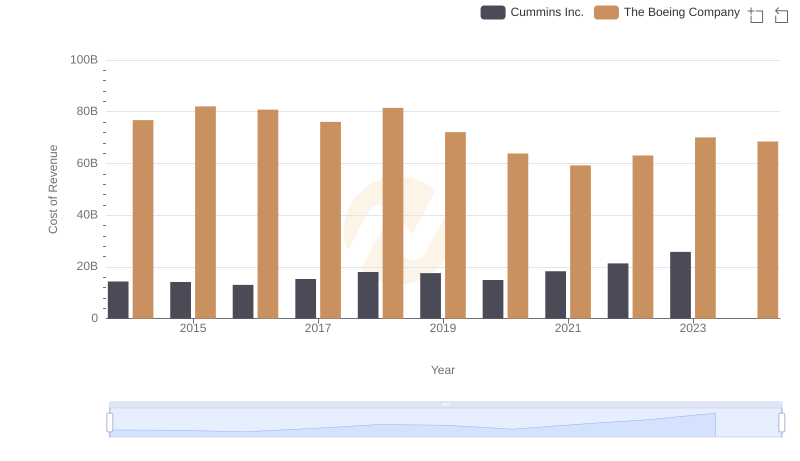
Cost of Revenue Comparison: The Boeing Company vs Cummins Inc.

Cost of Revenue Trends: The Boeing Company vs Waste Connections, Inc.
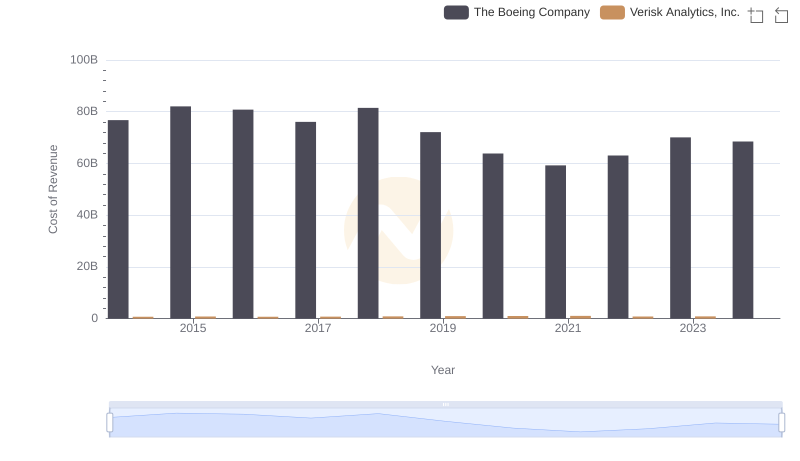
The Boeing Company vs Verisk Analytics, Inc.: Efficiency in Cost of Revenue Explored

Comparing SG&A Expenses: The Boeing Company vs Quanta Services, Inc. Trends and Insights