| __timestamp | The Boeing Company | Waste Connections, Inc. |
|---|---|---|
| Wednesday, January 1, 2014 | 90762000000 | 2079166000 |
| Thursday, January 1, 2015 | 96114000000 | 2117287000 |
| Friday, January 1, 2016 | 94571000000 | 3375863000 |
| Sunday, January 1, 2017 | 93392000000 | 4630488000 |
| Monday, January 1, 2018 | 101127000000 | 4922941000 |
| Tuesday, January 1, 2019 | 76559000000 | 5388679000 |
| Wednesday, January 1, 2020 | 58158000000 | 5445990000 |
| Friday, January 1, 2021 | 62286000000 | 6151361000 |
| Saturday, January 1, 2022 | 66608000000 | 7211859000 |
| Sunday, January 1, 2023 | 77794000000 | 8021951000 |
| Monday, January 1, 2024 | 66517000000 | 8919591000 |
Unleashing the power of data
In the ever-evolving landscape of American industry, The Boeing Company and Waste Connections, Inc. stand as titans in their respective fields. Over the past decade, Boeing's revenue trajectory has seen a rollercoaster of highs and lows. From 2014 to 2018, Boeing's revenue soared by approximately 11%, peaking in 2018. However, the subsequent years witnessed a decline, with a notable dip in 2020, reflecting the global challenges faced by the aviation sector.
Conversely, Waste Connections, Inc. has demonstrated a steady upward trend, with revenues nearly quadrupling from 2014 to 2023. This growth underscores the increasing importance of waste management in a sustainable future. While Boeing's revenue in 2023 rebounded to 78% of its 2018 peak, Waste Connections continued its ascent, highlighting the resilience and growth potential in essential services. Missing data for 2024 suggests an evolving narrative yet to unfold.
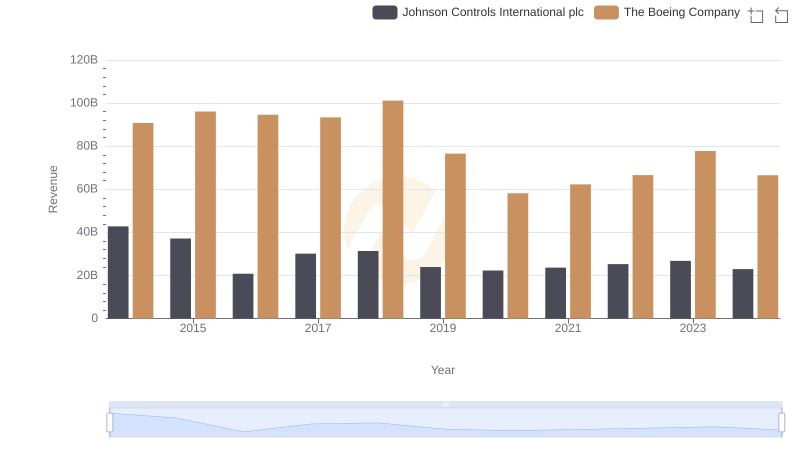
The Boeing Company vs Johnson Controls International plc: Examining Key Revenue Metrics
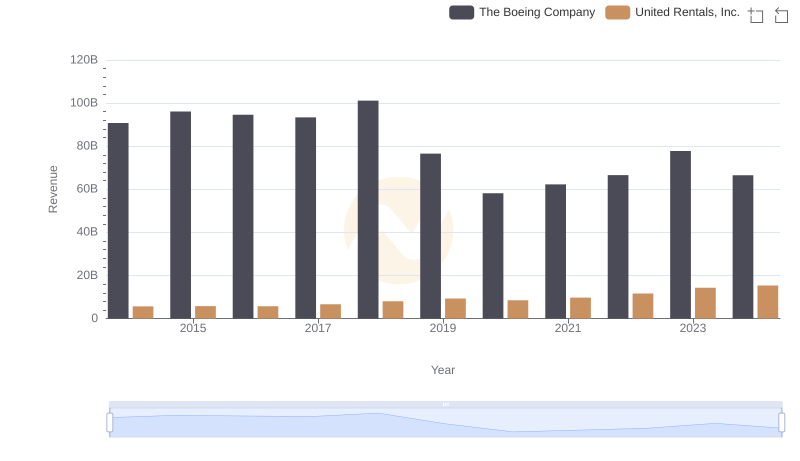
Revenue Insights: The Boeing Company and United Rentals, Inc. Performance Compared

The Boeing Company or Delta Air Lines, Inc.: Who Leads in Yearly Revenue?
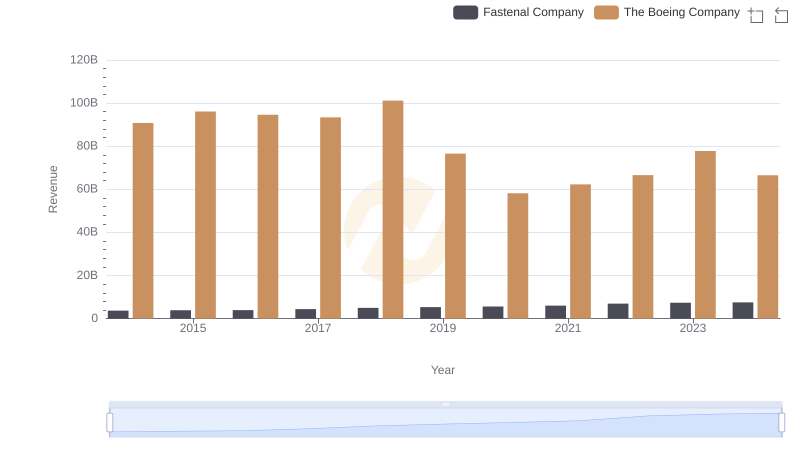
The Boeing Company and Fastenal Company: A Comprehensive Revenue Analysis
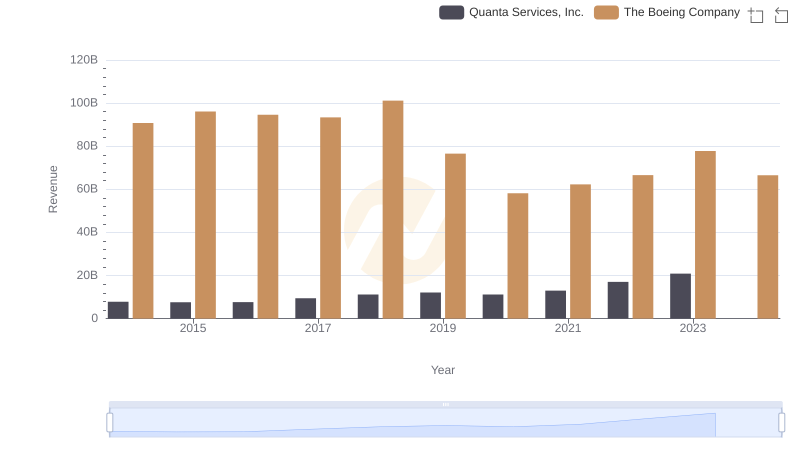
Breaking Down Revenue Trends: The Boeing Company vs Quanta Services, Inc.
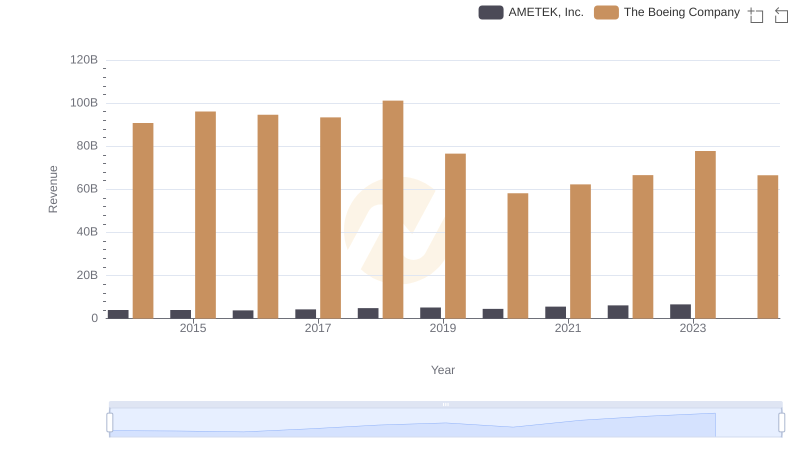
The Boeing Company and AMETEK, Inc.: A Comprehensive Revenue Analysis
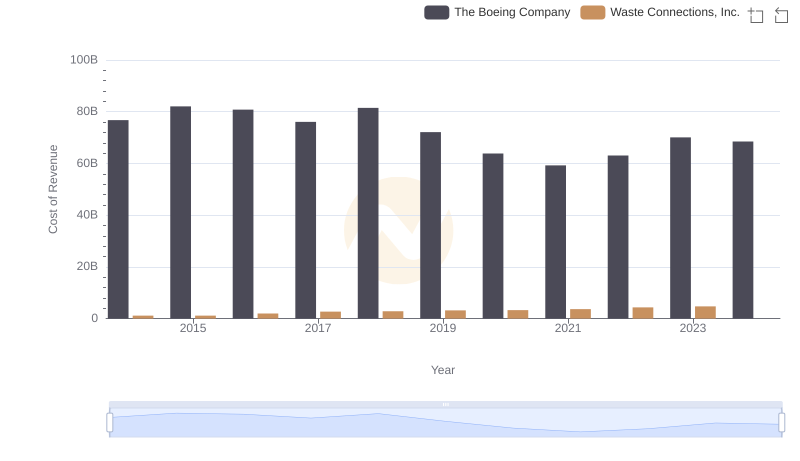
Cost of Revenue Trends: The Boeing Company vs Waste Connections, Inc.
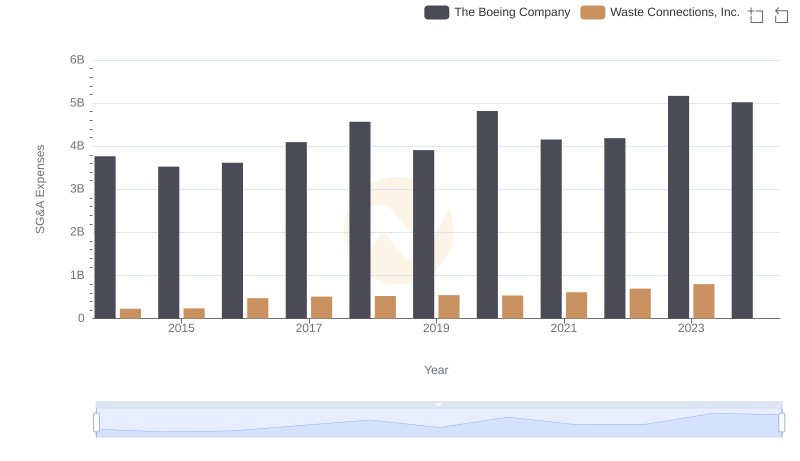
Who Optimizes SG&A Costs Better? The Boeing Company or Waste Connections, Inc.