| __timestamp | HEICO Corporation | Old Dominion Freight Line, Inc. |
|---|---|---|
| Wednesday, January 1, 2014 | 251213000 | 585590000 |
| Thursday, January 1, 2015 | 276790000 | 660570000 |
| Friday, January 1, 2016 | 325022000 | 671786000 |
| Sunday, January 1, 2017 | 372581000 | 783749000 |
| Monday, January 1, 2018 | 452287000 | 1046059000 |
| Tuesday, January 1, 2019 | 542136000 | 1078007000 |
| Wednesday, January 1, 2020 | 465714000 | 1168149000 |
| Friday, January 1, 2021 | 486243000 | 1651501000 |
| Saturday, January 1, 2022 | 592709000 | 2118962000 |
| Sunday, January 1, 2023 | 756767000 | 1972689000 |
| Monday, January 1, 2024 | 824455000 |
Infusing magic into the data realm
In the competitive landscape of the transportation and aerospace industries, Old Dominion Freight Line, Inc. and HEICO Corporation have demonstrated remarkable EBITDA growth over the past decade. From 2014 to 2023, Old Dominion Freight Line, Inc. saw its EBITDA surge by approximately 237%, peaking in 2022. Meanwhile, HEICO Corporation experienced a robust 228% increase, reaching its highest EBITDA in 2024.
Old Dominion's EBITDA growth reflects its strategic expansion and operational efficiency, particularly evident in the 2021-2022 period, where it jumped by 28%. HEICO, on the other hand, showcased consistent growth, with a notable 27% rise from 2022 to 2024.
While Old Dominion's data for 2024 is missing, the trends highlight the resilience and adaptability of both companies in navigating economic challenges and capitalizing on market opportunities.
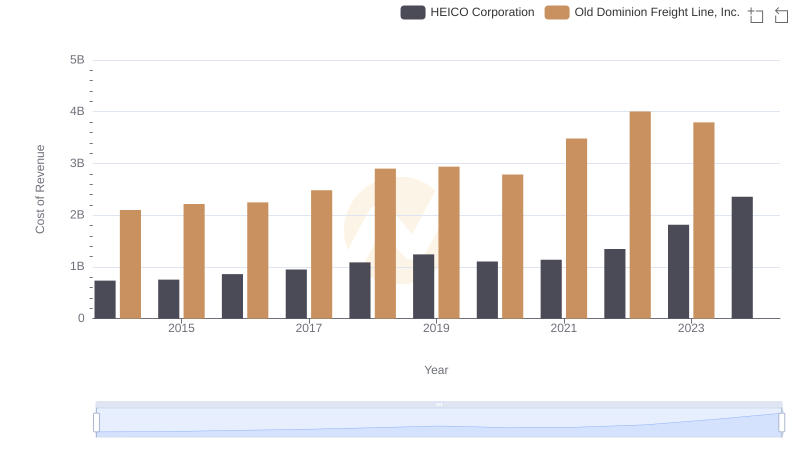
Cost of Revenue Trends: Old Dominion Freight Line, Inc. vs HEICO Corporation

Old Dominion Freight Line, Inc. and HEICO Corporation: A Detailed Gross Profit Analysis
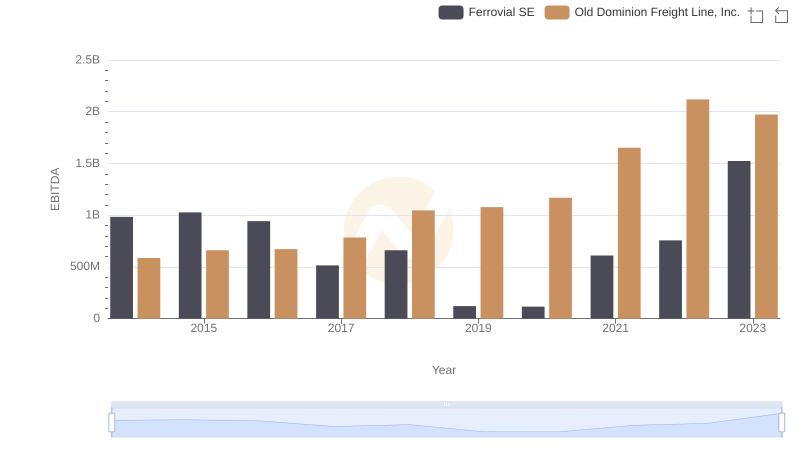
EBITDA Analysis: Evaluating Old Dominion Freight Line, Inc. Against Ferrovial SE
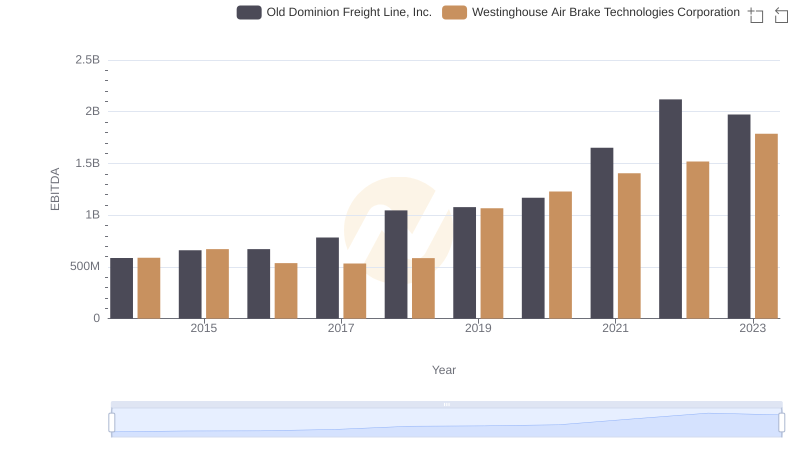
Old Dominion Freight Line, Inc. vs Westinghouse Air Brake Technologies Corporation: In-Depth EBITDA Performance Comparison
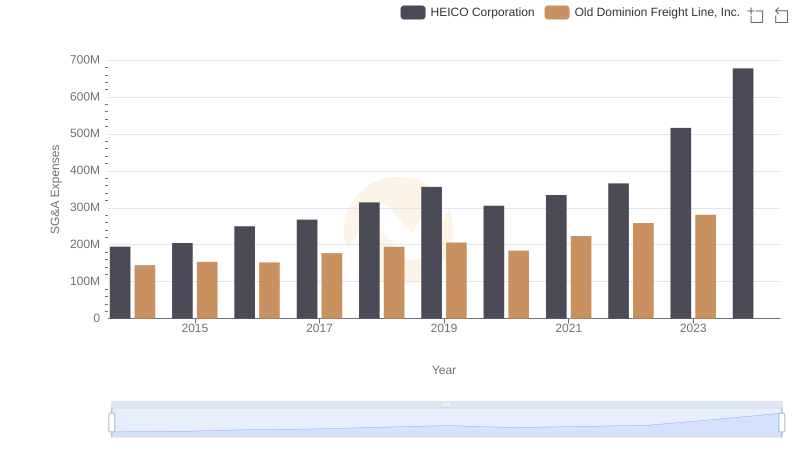
Selling, General, and Administrative Costs: Old Dominion Freight Line, Inc. vs HEICO Corporation
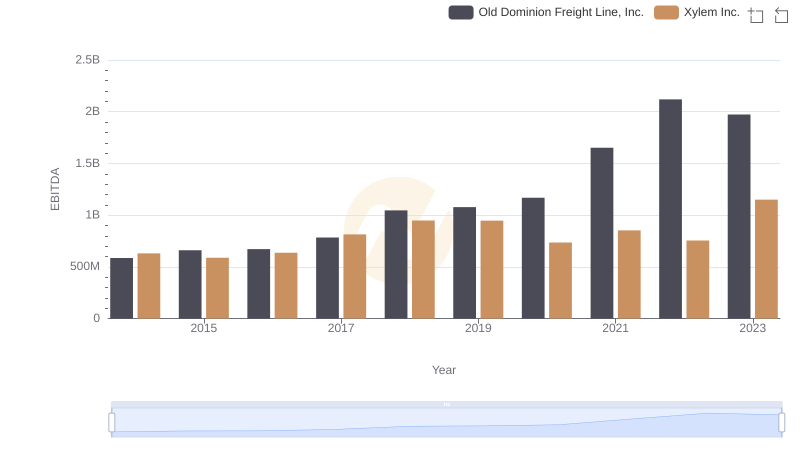
Old Dominion Freight Line, Inc. and Xylem Inc.: A Detailed Examination of EBITDA Performance
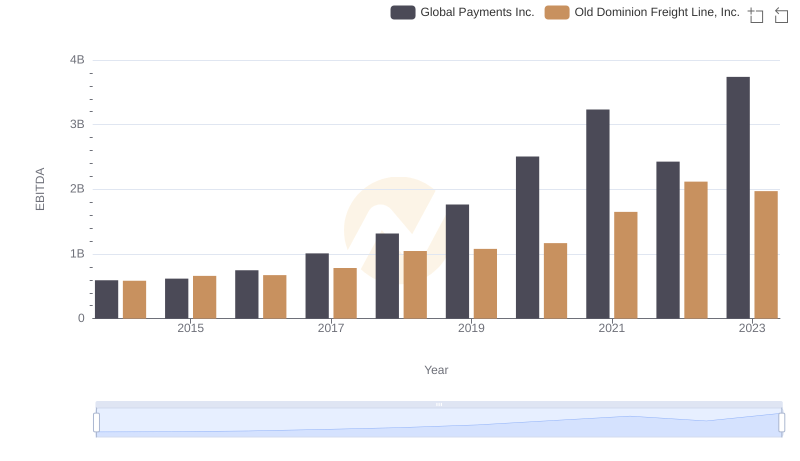
EBITDA Analysis: Evaluating Old Dominion Freight Line, Inc. Against Global Payments Inc.
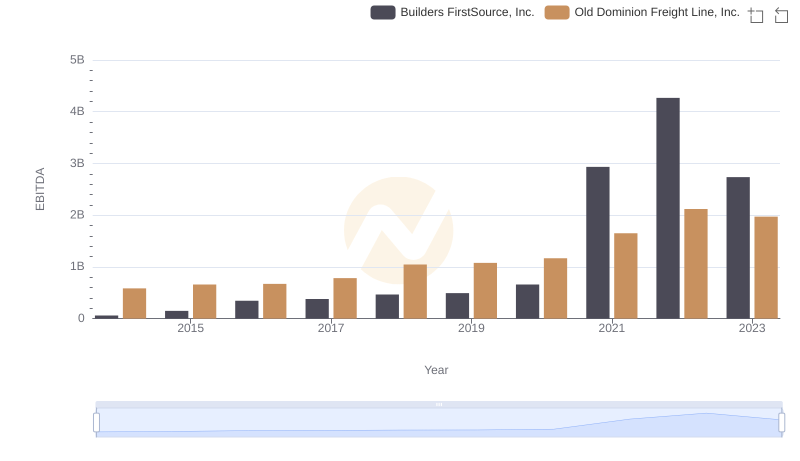
Comprehensive EBITDA Comparison: Old Dominion Freight Line, Inc. vs Builders FirstSource, Inc.