| __timestamp | Elbit Systems Ltd. | Ingersoll Rand Inc. |
|---|---|---|
| Wednesday, January 1, 2014 | 2958248000 | 2570005000 |
| Thursday, January 1, 2015 | 3107581000 | 2126900000 |
| Friday, January 1, 2016 | 3260219000 | 1939436000 |
| Sunday, January 1, 2017 | 3377825000 | 2375400000 |
| Monday, January 1, 2018 | 3683684000 | 2689800000 |
| Tuesday, January 1, 2019 | 4508400000 | 2451900000 |
| Wednesday, January 1, 2020 | 4662572000 | 4910200000 |
| Friday, January 1, 2021 | 5278521000 | 5152400000 |
| Saturday, January 1, 2022 | 5511549000 | 5916300000 |
| Sunday, January 1, 2023 | 5974744000 | 6876100000 |
| Monday, January 1, 2024 | 0 |
Igniting the spark of knowledge
In the competitive landscape of global industries, revenue performance is a key indicator of a company's success. Over the past decade, Ingersoll Rand Inc. and Elbit Systems Ltd. have demonstrated remarkable growth in their annual revenues. From 2014 to 2023, Elbit Systems Ltd. saw its revenue increase by approximately 102%, starting from $3 billion and reaching nearly $6 billion. Meanwhile, Ingersoll Rand Inc. experienced an even more impressive growth of around 167%, with revenues climbing from $2.6 billion to $6.9 billion.
This upward trend highlights the resilience and strategic prowess of both companies in navigating market challenges. Notably, Ingersoll Rand's revenue surpassed Elbit Systems in 2020, maintaining a lead through 2023. These insights underscore the dynamic nature of the industrial and defense sectors, where innovation and adaptability are crucial for sustained growth.
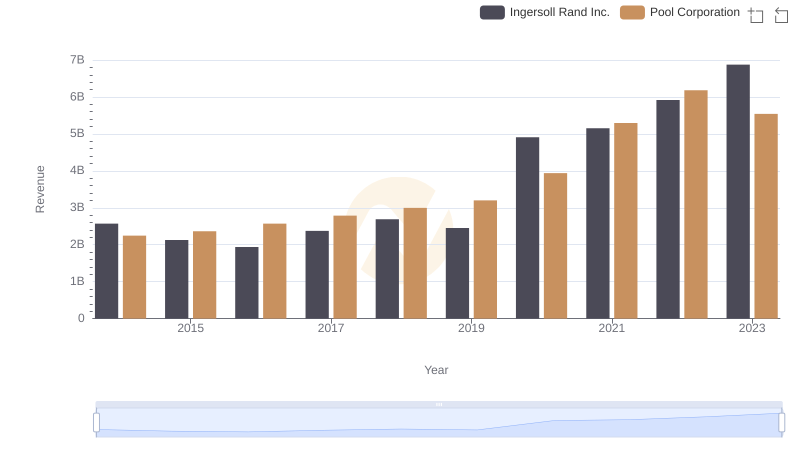
Ingersoll Rand Inc. vs Pool Corporation: Annual Revenue Growth Compared

Ingersoll Rand Inc. vs AECOM: Examining Key Revenue Metrics
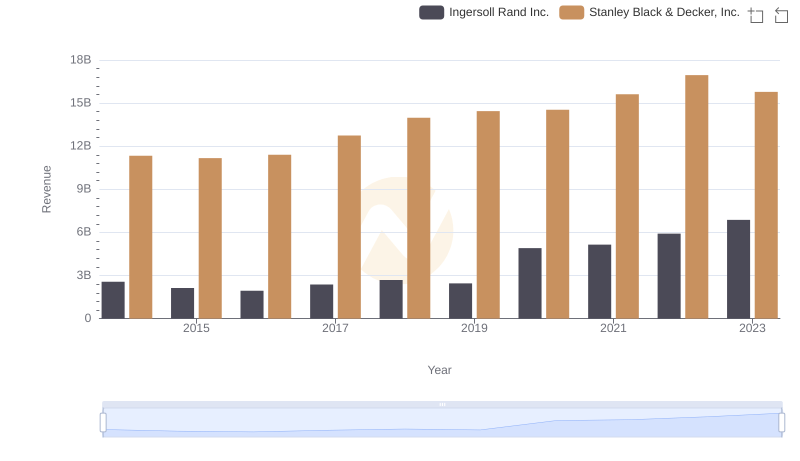
Ingersoll Rand Inc. or Stanley Black & Decker, Inc.: Who Leads in Yearly Revenue?
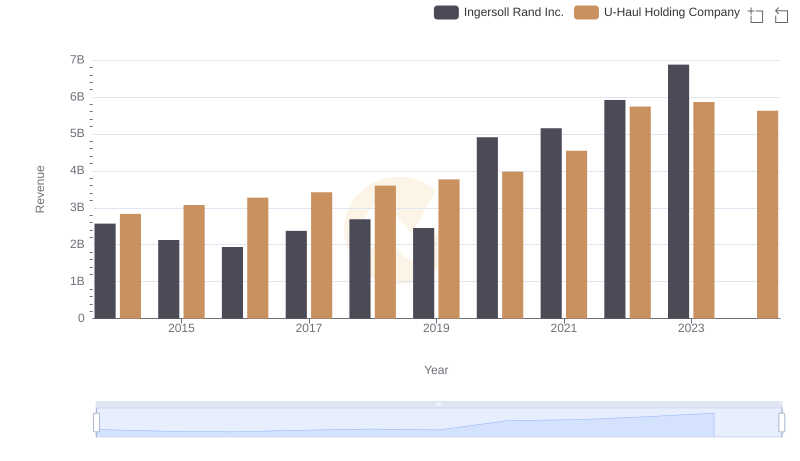
Revenue Showdown: Ingersoll Rand Inc. vs U-Haul Holding Company
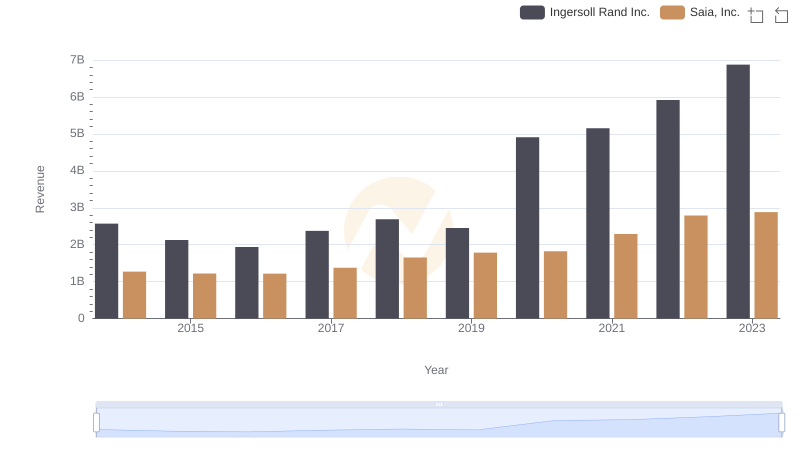
Ingersoll Rand Inc. and Saia, Inc.: A Comprehensive Revenue Analysis
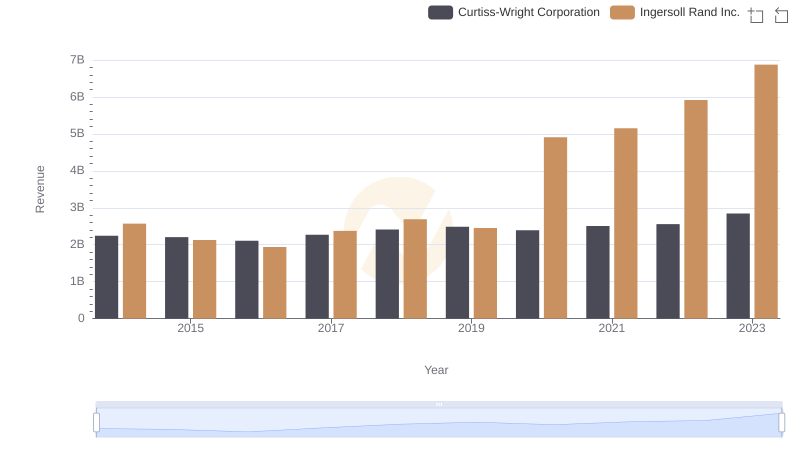
Ingersoll Rand Inc. or Curtiss-Wright Corporation: Who Leads in Yearly Revenue?
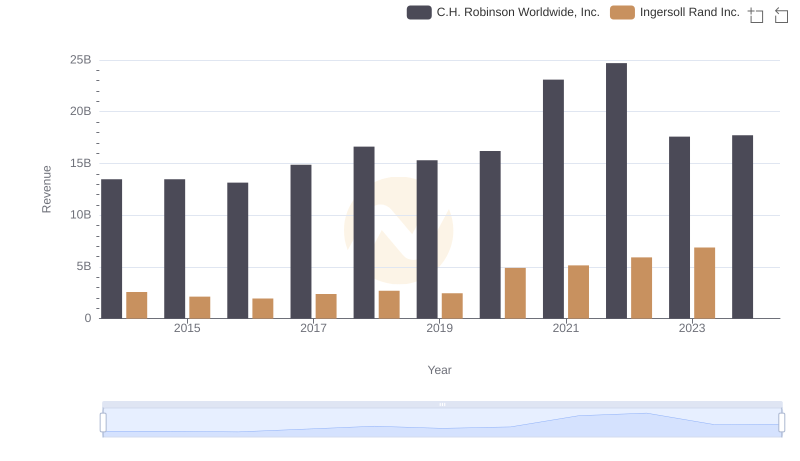
Comparing Revenue Performance: Ingersoll Rand Inc. or C.H. Robinson Worldwide, Inc.?
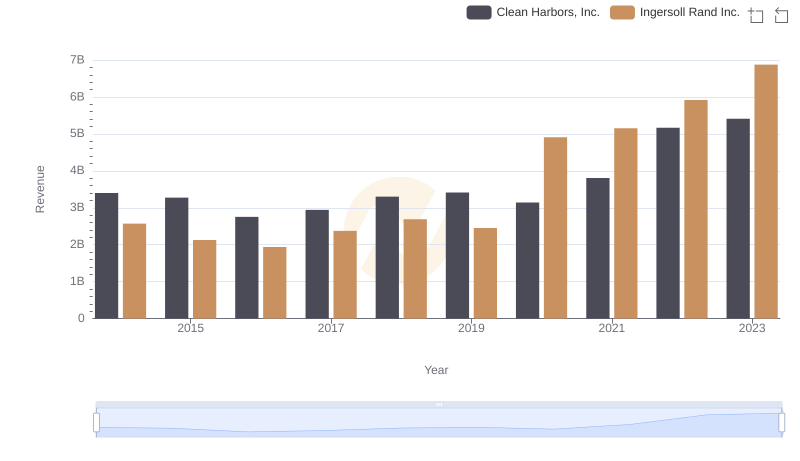
Comparing Revenue Performance: Ingersoll Rand Inc. or Clean Harbors, Inc.?
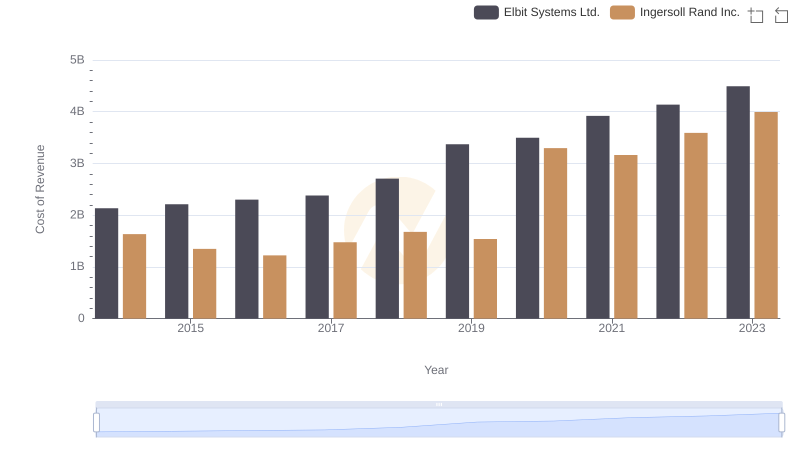
Cost of Revenue Trends: Ingersoll Rand Inc. vs Elbit Systems Ltd.
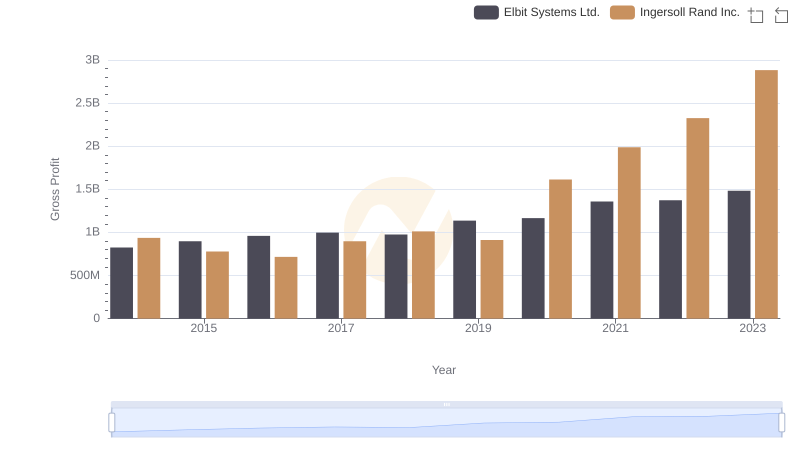
Gross Profit Analysis: Comparing Ingersoll Rand Inc. and Elbit Systems Ltd.
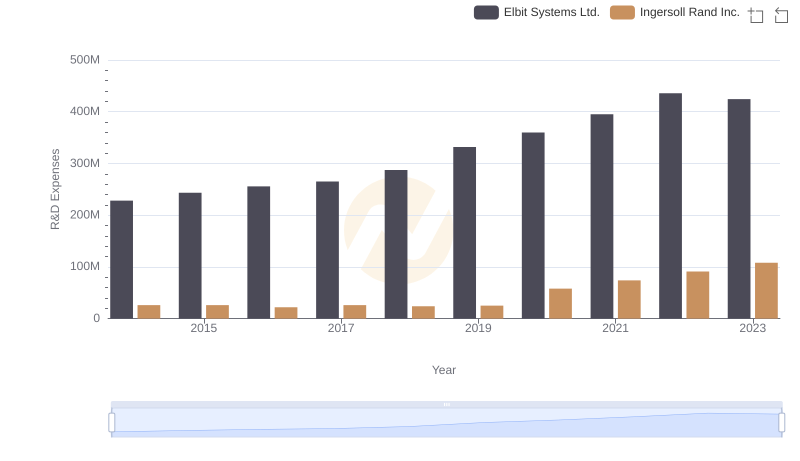
Ingersoll Rand Inc. vs Elbit Systems Ltd.: Strategic Focus on R&D Spending
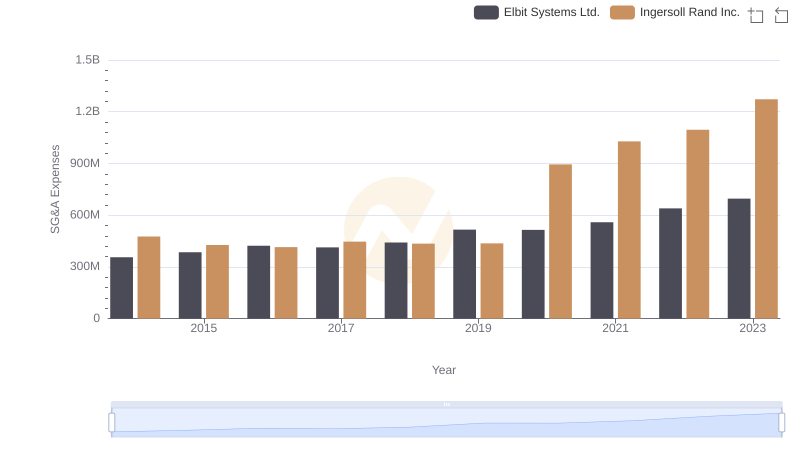
SG&A Efficiency Analysis: Comparing Ingersoll Rand Inc. and Elbit Systems Ltd.