| __timestamp | Infosys Limited | Synopsys, Inc. |
|---|---|---|
| Wednesday, January 1, 2014 | 5374000000 | 456885000 |
| Thursday, January 1, 2015 | 5950000000 | 518920000 |
| Friday, January 1, 2016 | 6446000000 | 542962000 |
| Sunday, January 1, 2017 | 7001000000 | 654184000 |
| Monday, January 1, 2018 | 7687000000 | 735898000 |
| Tuesday, January 1, 2019 | 8552000000 | 752946000 |
| Wednesday, January 1, 2020 | 8828000000 | 794690000 |
| Friday, January 1, 2021 | 10996000000 | 861777000 |
| Saturday, January 1, 2022 | 12709000000 | 1063697000 |
| Sunday, January 1, 2023 | 13096000000 | 1222193000 |
| Monday, January 1, 2024 | 1245289000 |
In pursuit of knowledge
In the ever-evolving landscape of global technology, understanding the cost of revenue is crucial for assessing a company's financial health. From 2014 to 2023, Infosys Limited and Synopsys, Inc. have shown distinct trends in their cost of revenue. Infosys, a leader in IT services, has seen a steady increase, with costs rising by approximately 144% over the decade, peaking at $13 billion in 2023. This growth reflects its expanding operations and market reach. In contrast, Synopsys, a key player in electronic design automation, has experienced a more modest increase of around 170%, reaching $1.2 billion in 2023. This indicates a strategic focus on efficiency and innovation. Notably, data for Infosys in 2024 is missing, highlighting potential reporting gaps. These insights offer a window into the strategic priorities and operational efficiencies of these tech giants.
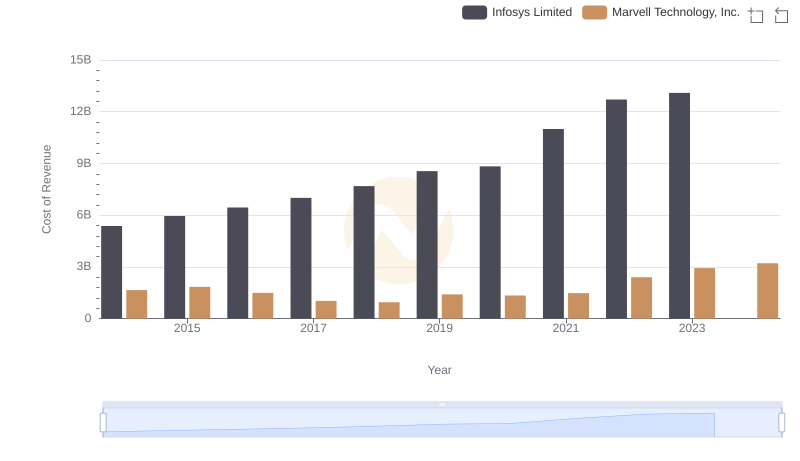
Cost of Revenue Trends: Infosys Limited vs Marvell Technology, Inc.
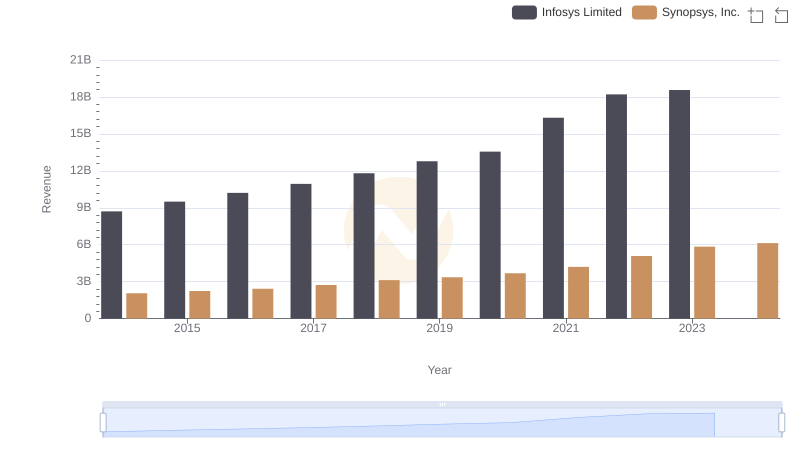
Revenue Insights: Infosys Limited and Synopsys, Inc. Performance Compared
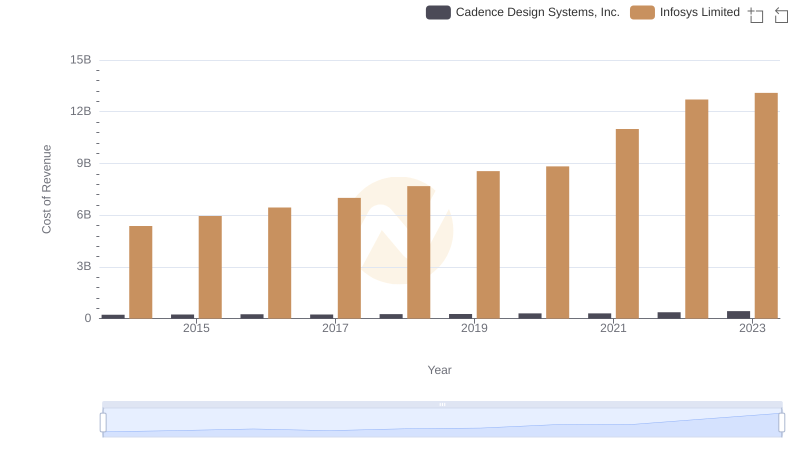
Cost Insights: Breaking Down Infosys Limited and Cadence Design Systems, Inc.'s Expenses
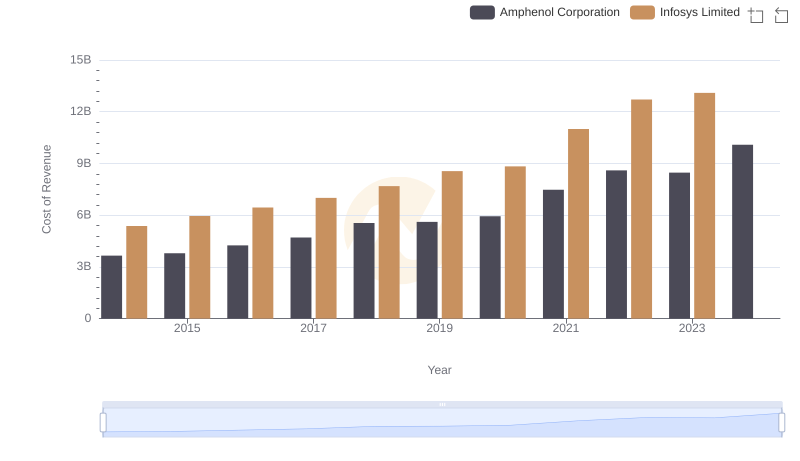
Cost of Revenue: Key Insights for Infosys Limited and Amphenol Corporation
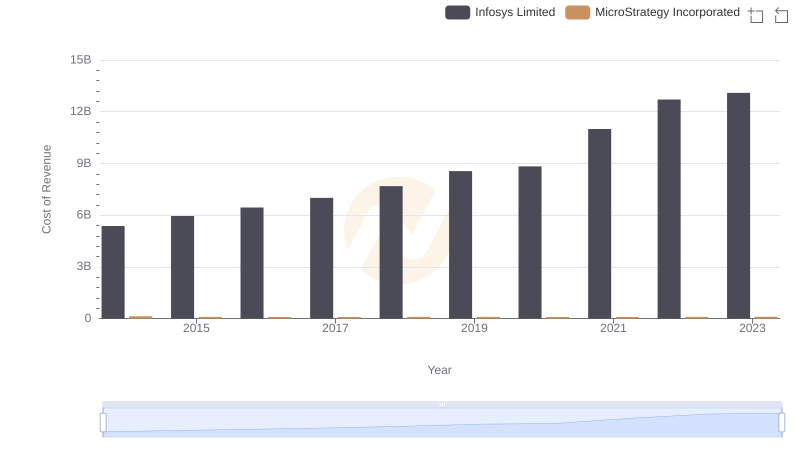
Cost of Revenue Comparison: Infosys Limited vs MicroStrategy Incorporated
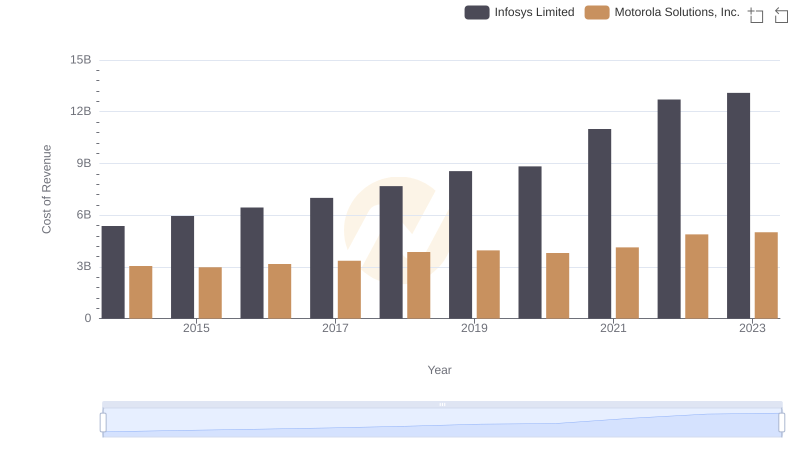
Cost of Revenue Comparison: Infosys Limited vs Motorola Solutions, Inc.
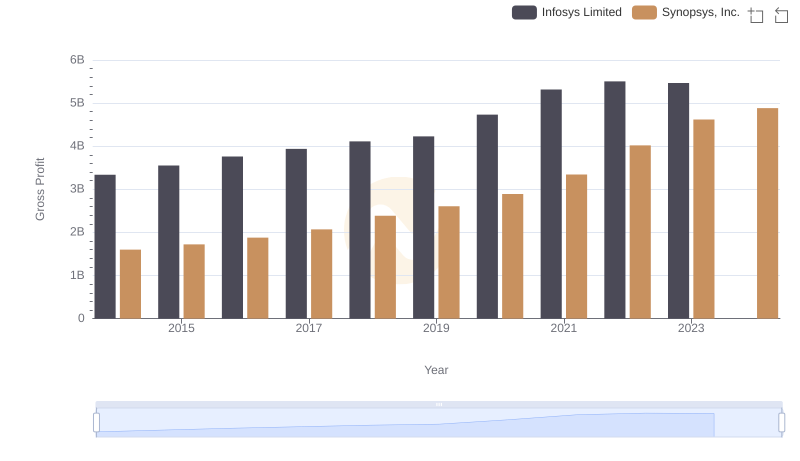
Gross Profit Analysis: Comparing Infosys Limited and Synopsys, Inc.
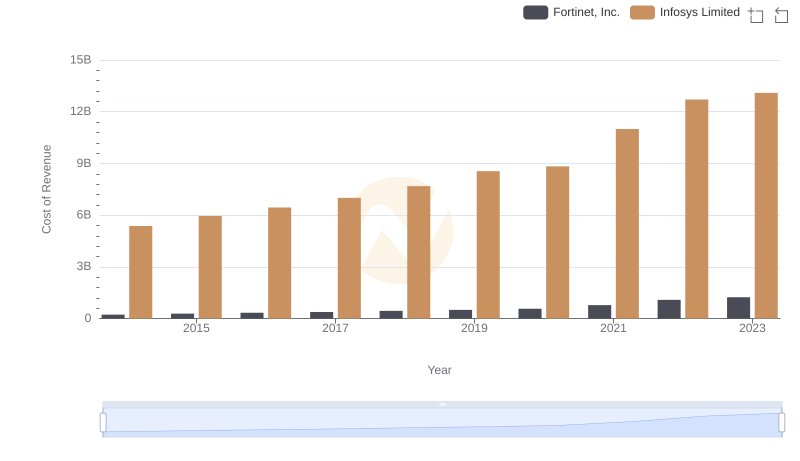
Cost of Revenue Comparison: Infosys Limited vs Fortinet, Inc.
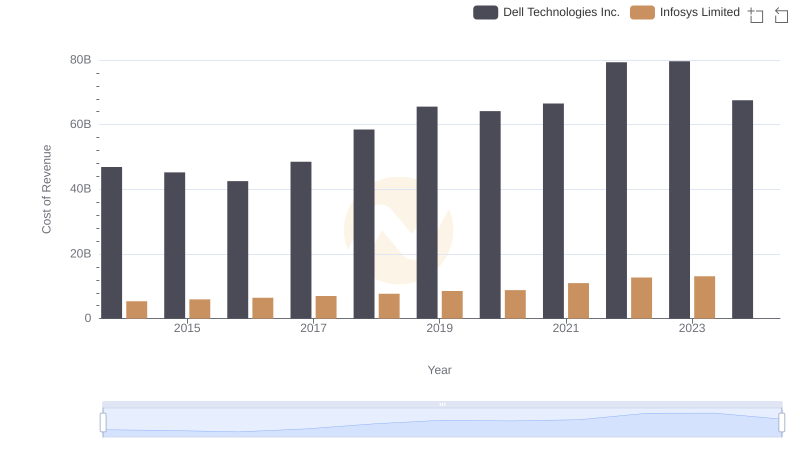
Cost Insights: Breaking Down Infosys Limited and Dell Technologies Inc.'s Expenses
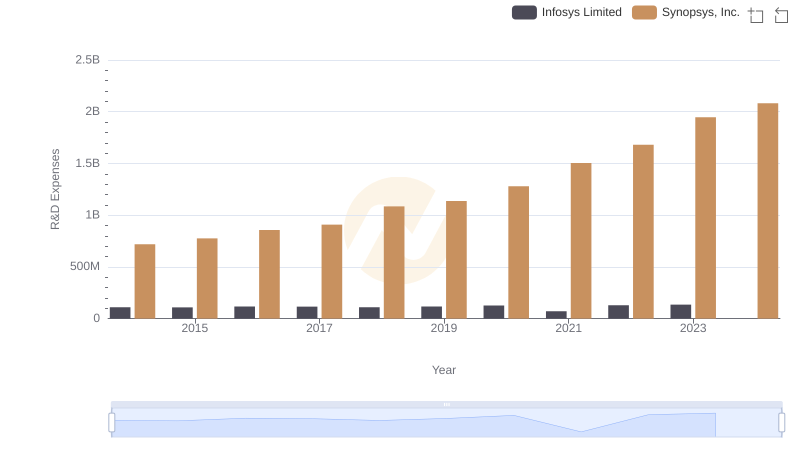
Research and Development Investment: Infosys Limited vs Synopsys, Inc.
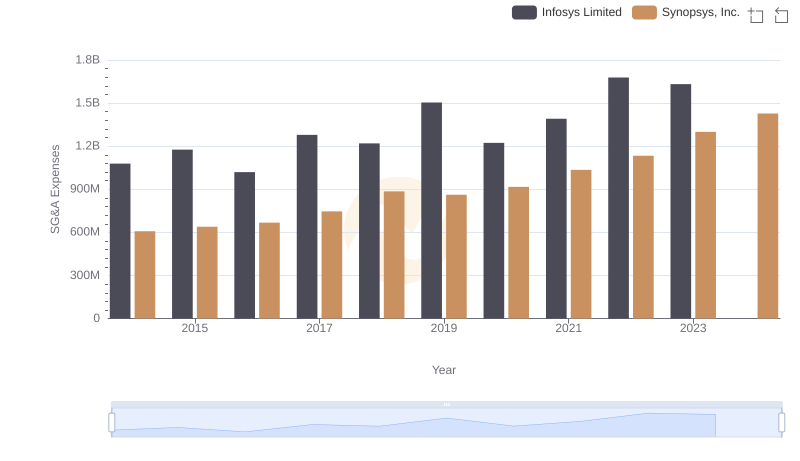
Selling, General, and Administrative Costs: Infosys Limited vs Synopsys, Inc.
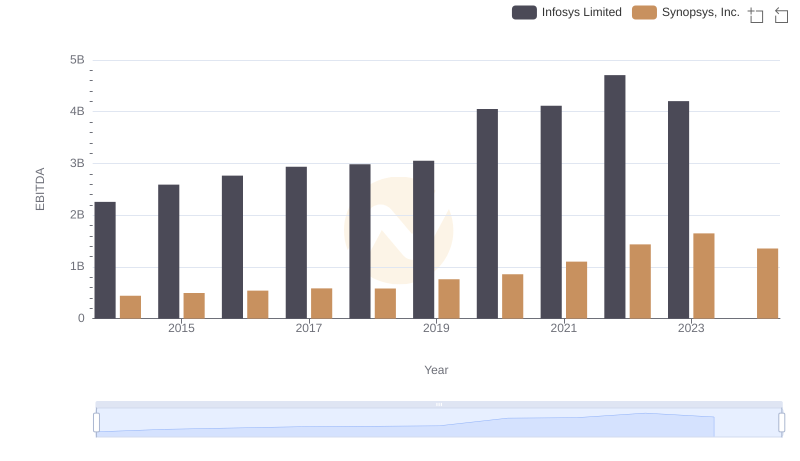
EBITDA Performance Review: Infosys Limited vs Synopsys, Inc.