| __timestamp | Amphenol Corporation | Infosys Limited |
|---|---|---|
| Wednesday, January 1, 2014 | 3651700000 | 5374000000 |
| Thursday, January 1, 2015 | 3789200000 | 5950000000 |
| Friday, January 1, 2016 | 4246400000 | 6446000000 |
| Sunday, January 1, 2017 | 4701400000 | 7001000000 |
| Monday, January 1, 2018 | 5547100000 | 7687000000 |
| Tuesday, January 1, 2019 | 5609400000 | 8552000000 |
| Wednesday, January 1, 2020 | 5934800000 | 8828000000 |
| Friday, January 1, 2021 | 7474500000 | 10996000000 |
| Saturday, January 1, 2022 | 8594800000 | 12709000000 |
| Sunday, January 1, 2023 | 8470600000 | 13096000000 |
| Monday, January 1, 2024 | 10083000000 |
In pursuit of knowledge
In the ever-evolving landscape of global business, understanding the cost of revenue is crucial for evaluating a company's financial health. This analysis delves into the cost of revenue trends for Infosys Limited and Amphenol Corporation from 2014 to 2023. Over this period, Infosys Limited has seen a steady increase, with costs rising by approximately 144%, peaking at $13.1 billion in 2023. Meanwhile, Amphenol Corporation's cost of revenue surged by about 176%, reaching $10.1 billion in 2024. This growth reflects the companies' strategic investments and market expansions. Notably, the data for Infosys in 2024 is missing, highlighting the need for continuous data monitoring. As these industry giants navigate the complexities of the global market, their cost of revenue trends offer valuable insights into their operational efficiencies and market strategies.
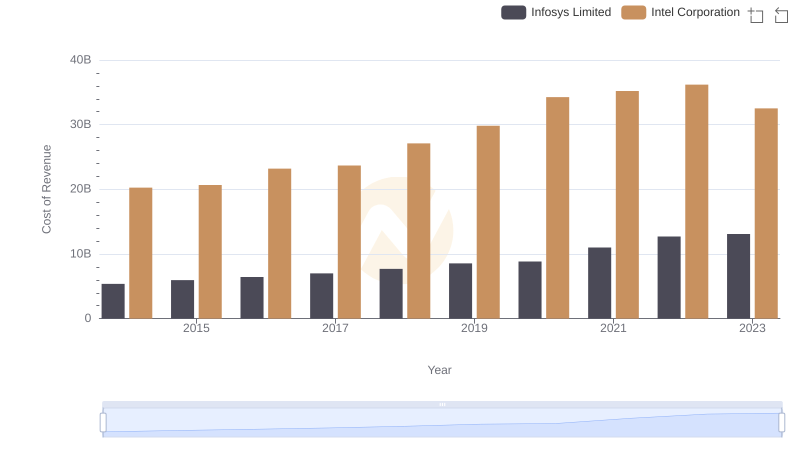
Infosys Limited vs Intel Corporation: Efficiency in Cost of Revenue Explored
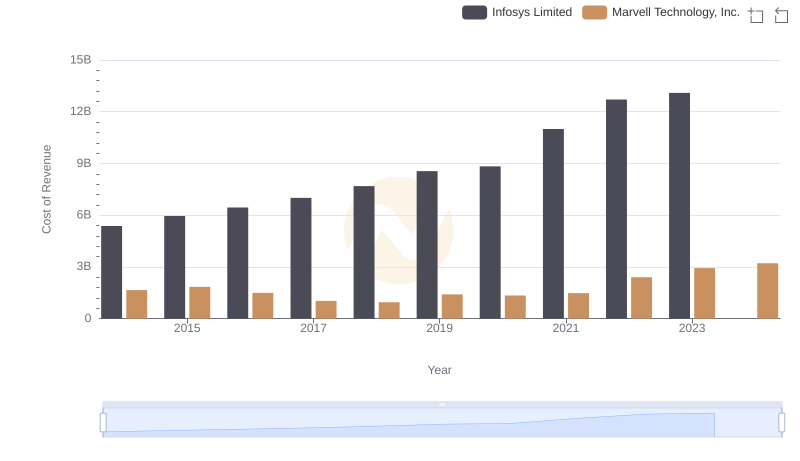
Cost of Revenue Trends: Infosys Limited vs Marvell Technology, Inc.
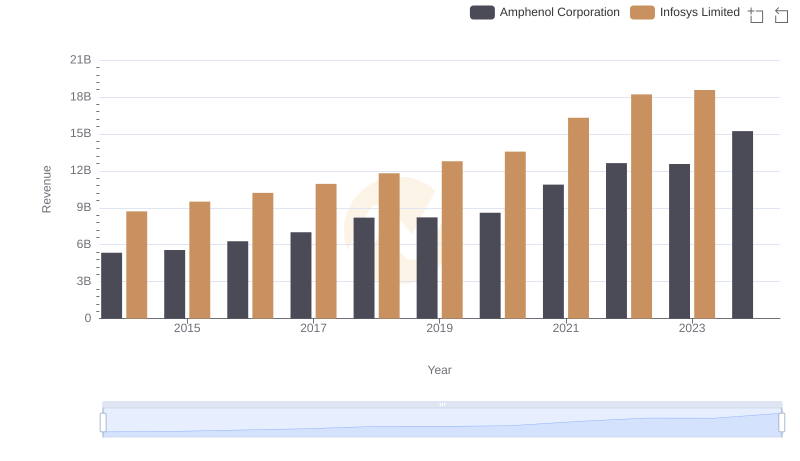
Infosys Limited vs Amphenol Corporation: Annual Revenue Growth Compared
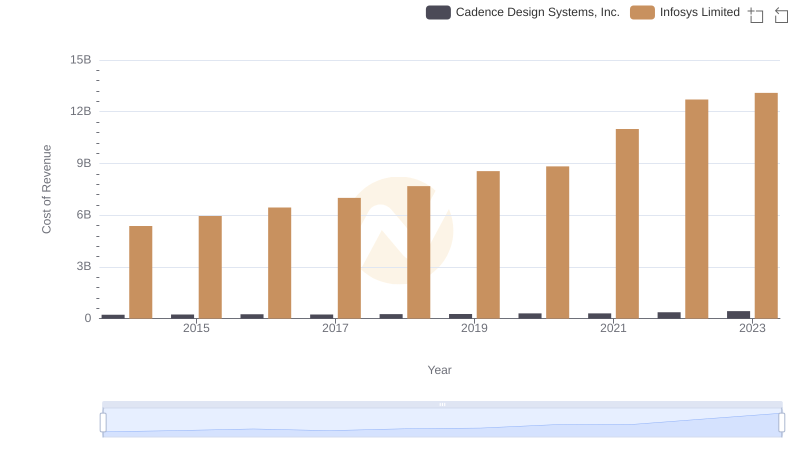
Cost Insights: Breaking Down Infosys Limited and Cadence Design Systems, Inc.'s Expenses
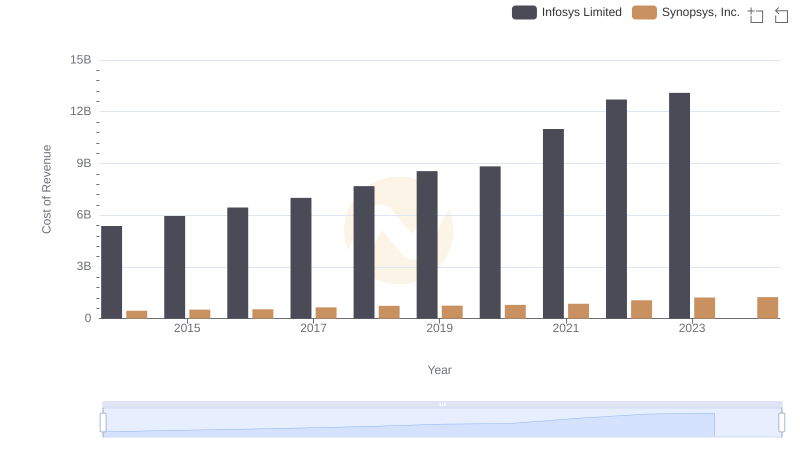
Cost of Revenue: Key Insights for Infosys Limited and Synopsys, Inc.
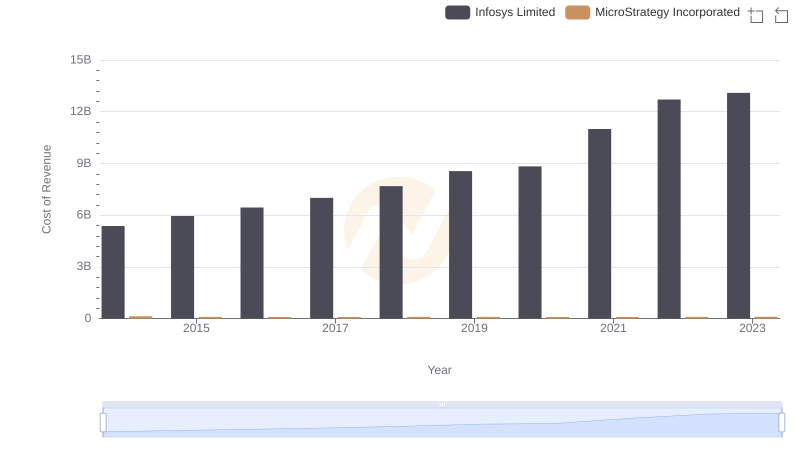
Cost of Revenue Comparison: Infosys Limited vs MicroStrategy Incorporated
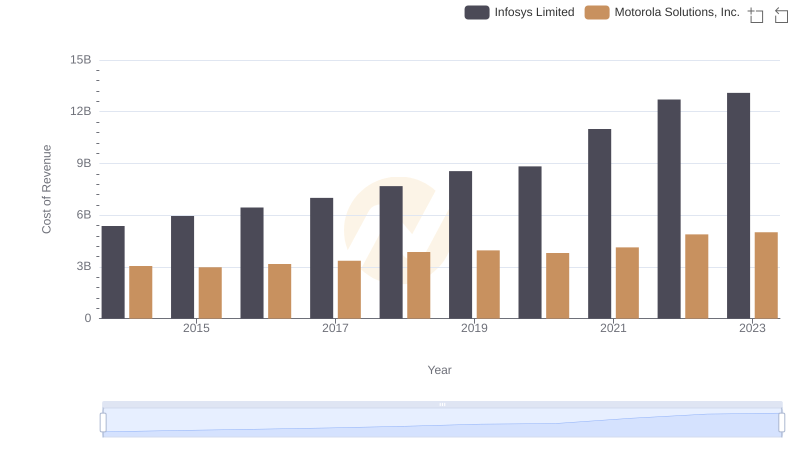
Cost of Revenue Comparison: Infosys Limited vs Motorola Solutions, Inc.
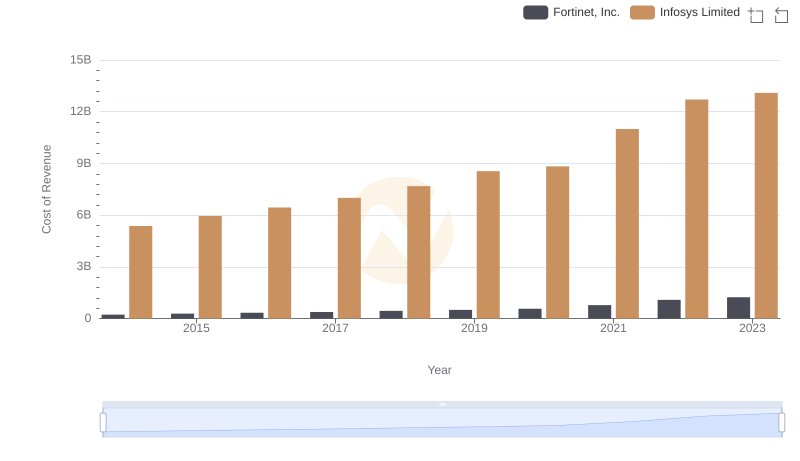
Cost of Revenue Comparison: Infosys Limited vs Fortinet, Inc.
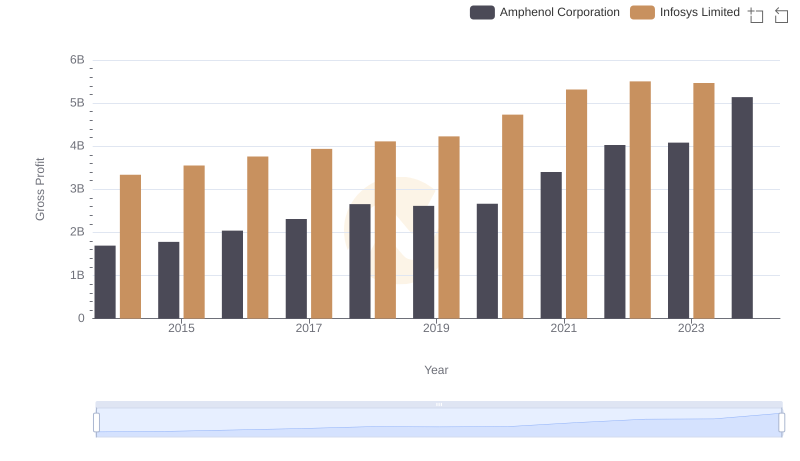
Infosys Limited vs Amphenol Corporation: A Gross Profit Performance Breakdown
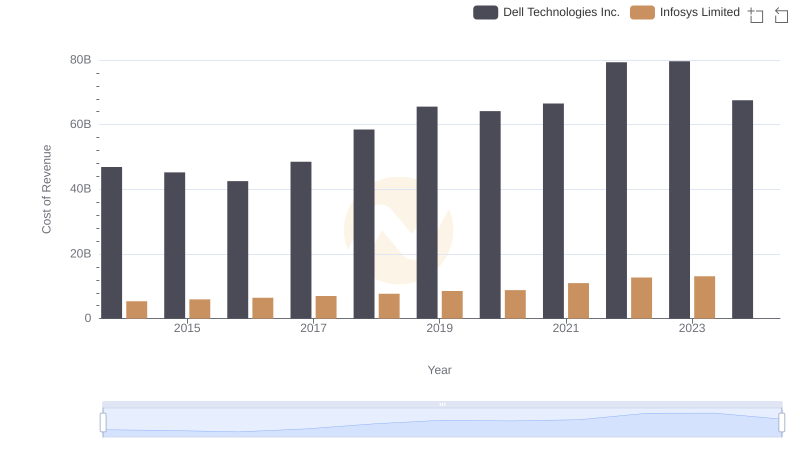
Cost Insights: Breaking Down Infosys Limited and Dell Technologies Inc.'s Expenses
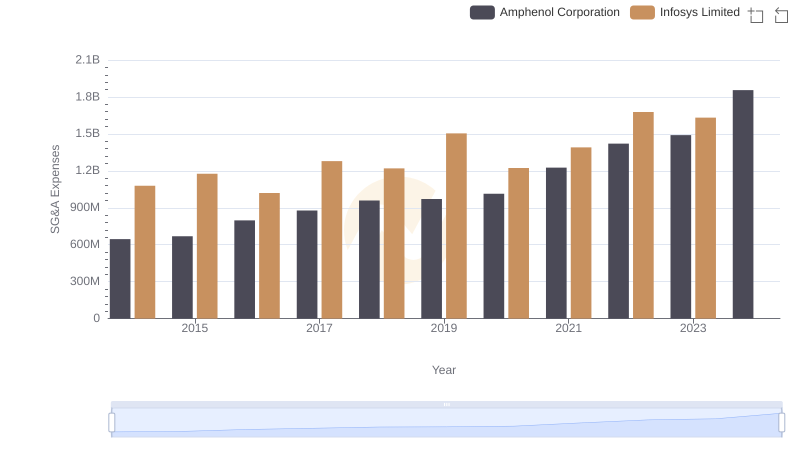
Who Optimizes SG&A Costs Better? Infosys Limited or Amphenol Corporation
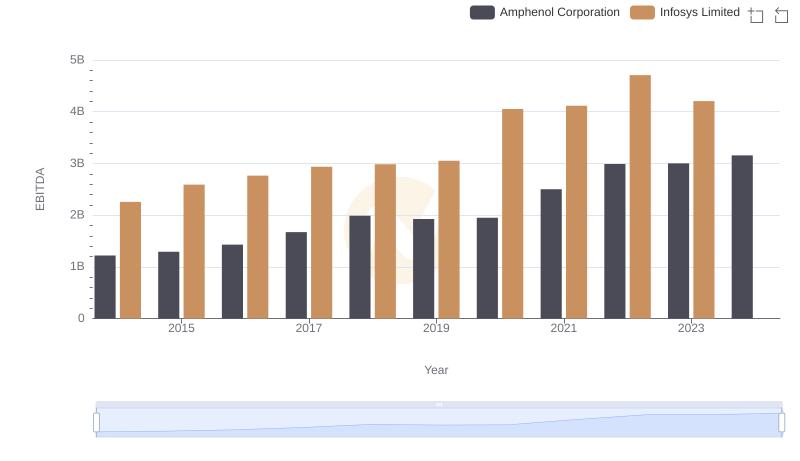
A Side-by-Side Analysis of EBITDA: Infosys Limited and Amphenol Corporation