| __timestamp | Infosys Limited | MicroStrategy Incorporated |
|---|---|---|
| Wednesday, January 1, 2014 | 5374000000 | 135210000 |
| Thursday, January 1, 2015 | 5950000000 | 101108000 |
| Friday, January 1, 2016 | 6446000000 | 93147000 |
| Sunday, January 1, 2017 | 7001000000 | 96649000 |
| Monday, January 1, 2018 | 7687000000 | 99499000 |
| Tuesday, January 1, 2019 | 8552000000 | 99974000 |
| Wednesday, January 1, 2020 | 8828000000 | 91055000 |
| Friday, January 1, 2021 | 10996000000 | 91909000 |
| Saturday, January 1, 2022 | 12709000000 | 102989000 |
| Sunday, January 1, 2023 | 13096000000 | 109944000 |
| Monday, January 1, 2024 | 129468000 |
Unveiling the hidden dimensions of data
In the ever-evolving landscape of global business, understanding the cost of revenue is crucial for evaluating a company's efficiency and profitability. This comparison between Infosys Limited and MicroStrategy Incorporated from 2014 to 2023 offers a fascinating glimpse into their financial journeys.
Infosys, a titan in the IT services sector, has seen its cost of revenue grow by approximately 144% over the past decade, reflecting its expanding operations and market reach. In contrast, MicroStrategy, a leader in business intelligence software, has maintained a relatively stable cost of revenue, with only a modest increase of around 19% during the same period.
This stark difference highlights the diverse strategies and market dynamics faced by these companies. While Infosys's growth trajectory underscores its aggressive expansion, MicroStrategy's steady figures suggest a focus on efficiency and cost management. Such insights are invaluable for investors and analysts alike.
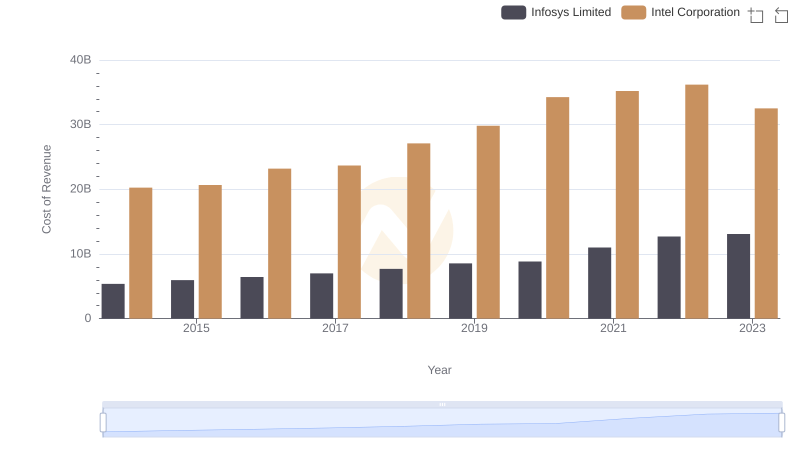
Infosys Limited vs Intel Corporation: Efficiency in Cost of Revenue Explored
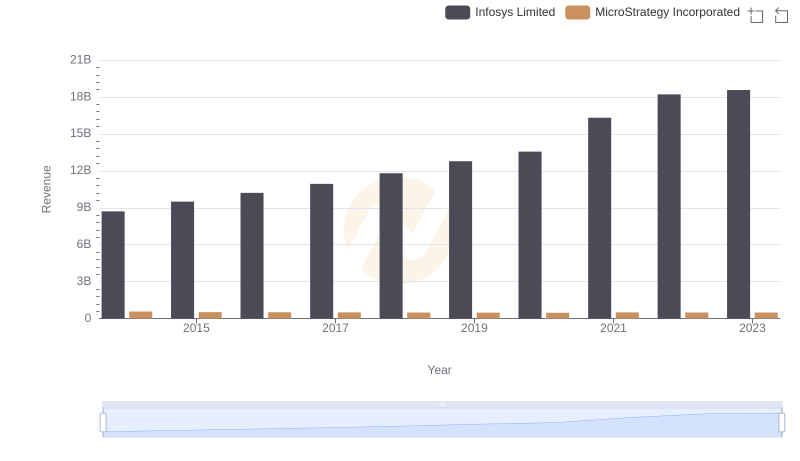
Infosys Limited or MicroStrategy Incorporated: Who Leads in Yearly Revenue?
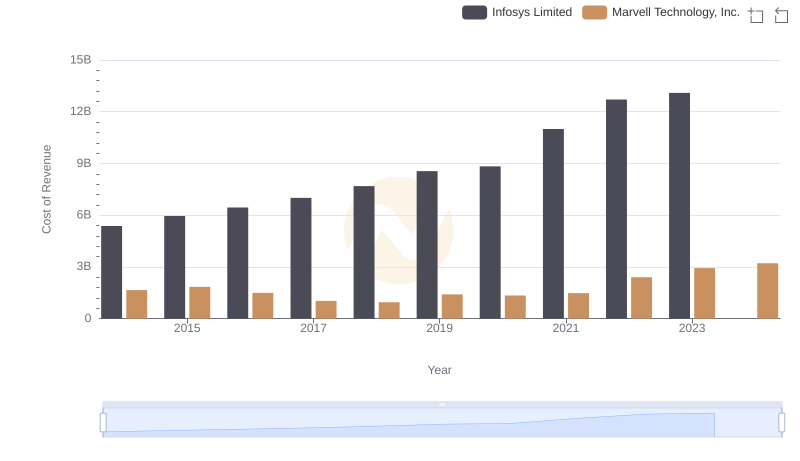
Cost of Revenue Trends: Infosys Limited vs Marvell Technology, Inc.
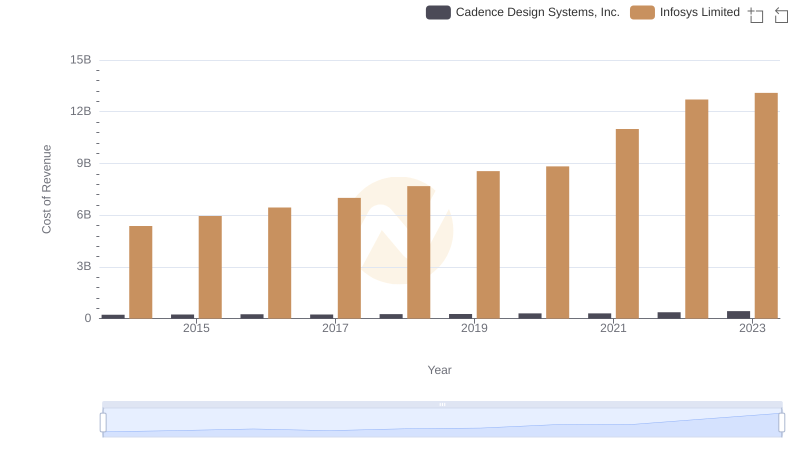
Cost Insights: Breaking Down Infosys Limited and Cadence Design Systems, Inc.'s Expenses
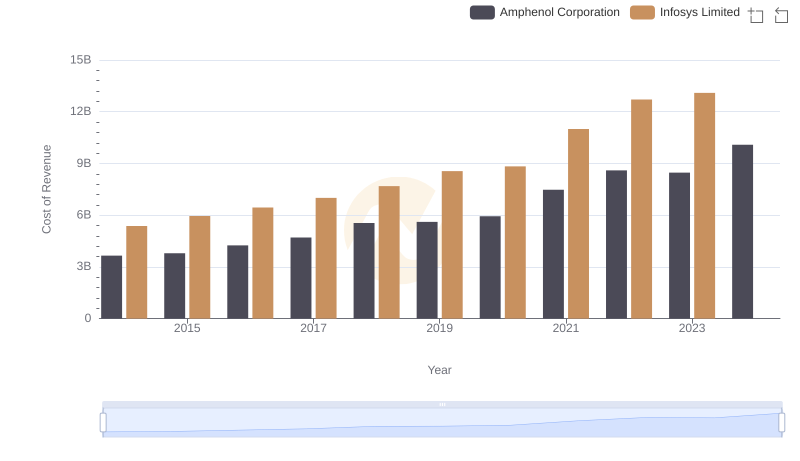
Cost of Revenue: Key Insights for Infosys Limited and Amphenol Corporation
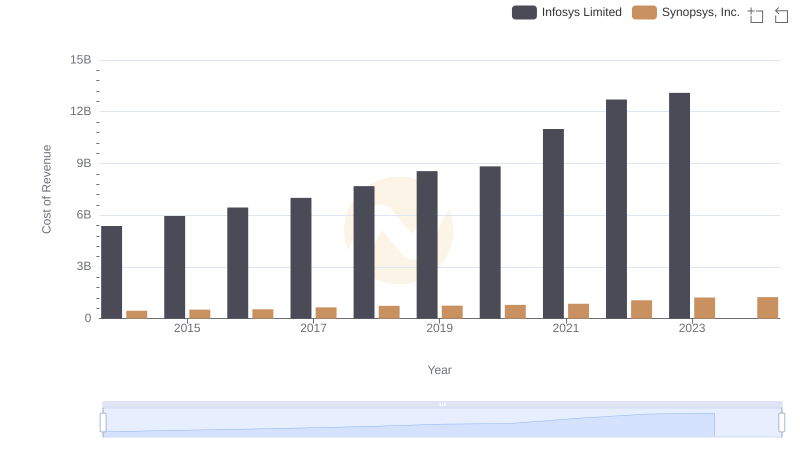
Cost of Revenue: Key Insights for Infosys Limited and Synopsys, Inc.
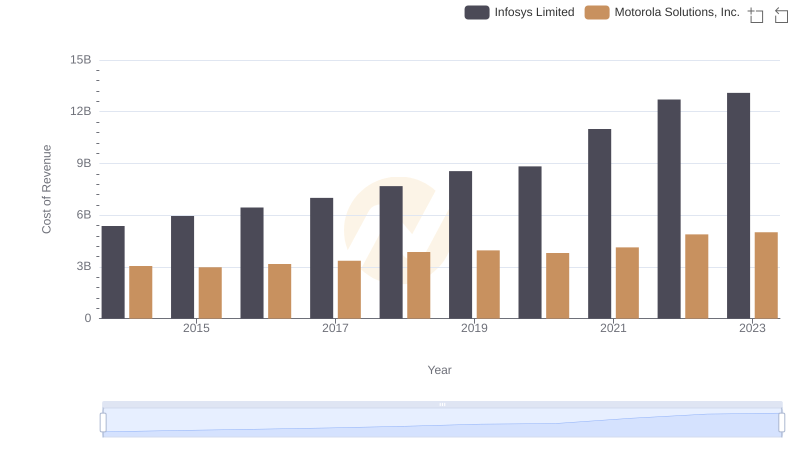
Cost of Revenue Comparison: Infosys Limited vs Motorola Solutions, Inc.
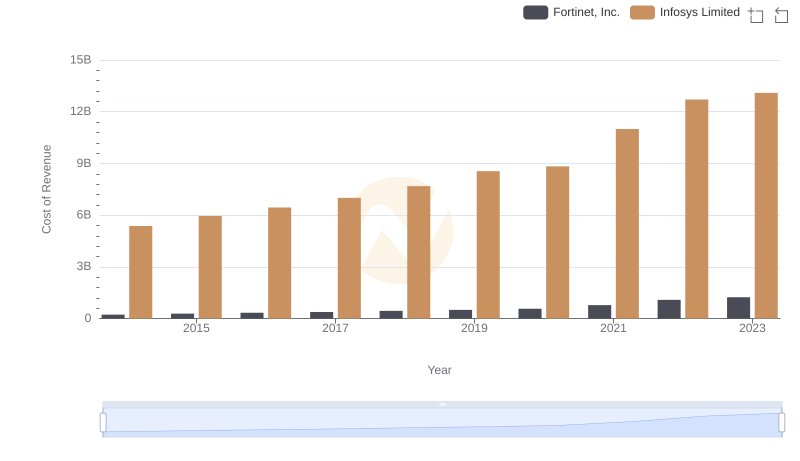
Cost of Revenue Comparison: Infosys Limited vs Fortinet, Inc.
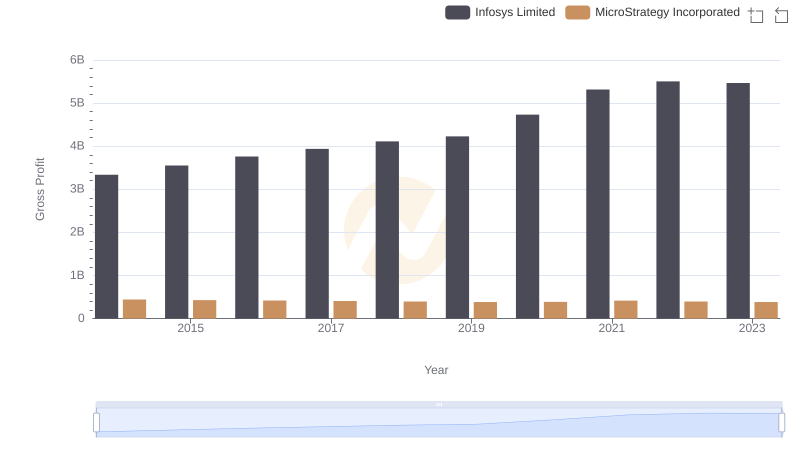
Who Generates Higher Gross Profit? Infosys Limited or MicroStrategy Incorporated
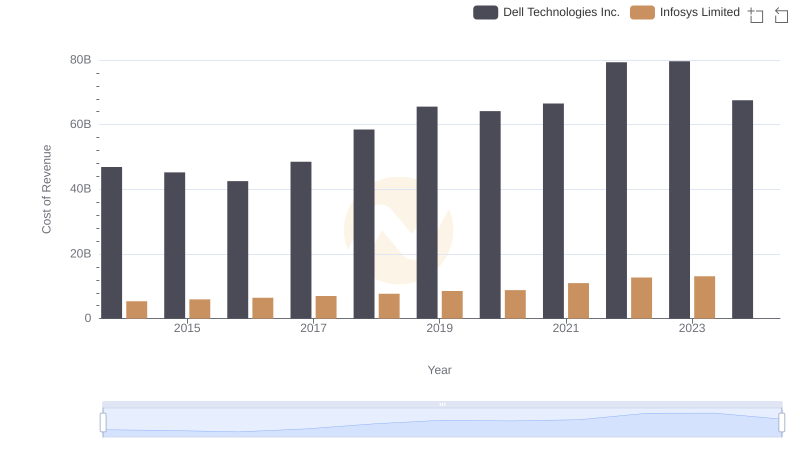
Cost Insights: Breaking Down Infosys Limited and Dell Technologies Inc.'s Expenses
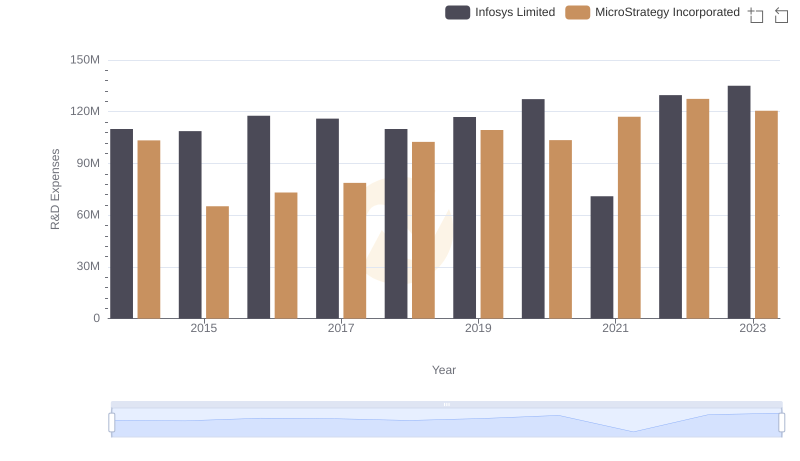
Analyzing R&D Budgets: Infosys Limited vs MicroStrategy Incorporated
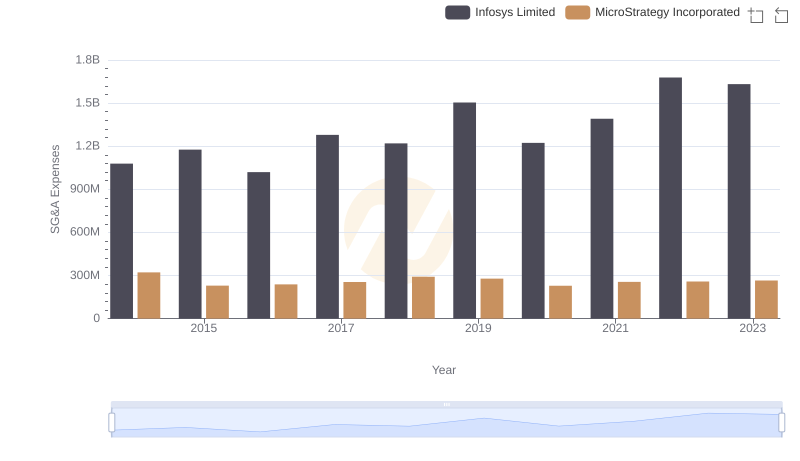
Breaking Down SG&A Expenses: Infosys Limited vs MicroStrategy Incorporated