| __timestamp | II-VI Incorporated | Infosys Limited |
|---|---|---|
| Wednesday, January 1, 2014 | 456545000 | 5374000000 |
| Thursday, January 1, 2015 | 470363000 | 5950000000 |
| Friday, January 1, 2016 | 514403000 | 6446000000 |
| Sunday, January 1, 2017 | 583693000 | 7001000000 |
| Monday, January 1, 2018 | 696591000 | 7687000000 |
| Tuesday, January 1, 2019 | 841147000 | 8552000000 |
| Wednesday, January 1, 2020 | 1560521000 | 8828000000 |
| Friday, January 1, 2021 | 1889678000 | 10996000000 |
| Saturday, January 1, 2022 | 2051120000 | 12709000000 |
| Sunday, January 1, 2023 | 3541817000 | 13096000000 |
| Monday, January 1, 2024 | 3251724000 |
Unveiling the hidden dimensions of data
In the ever-evolving landscape of global business, understanding the cost of revenue is crucial for assessing a company's financial health. This analysis delves into the cost of revenue trends for Infosys Limited and II-VI Incorporated from 2014 to 2023.
Infosys, a titan in the IT services sector, has seen its cost of revenue grow by approximately 144% over the past decade. Starting at around $5.4 billion in 2014, it reached a peak of $13.1 billion in 2023. This steady increase reflects Infosys's expanding operations and market reach.
In contrast, II-VI Incorporated, a leader in engineered materials and optoelectronic components, experienced a staggering 676% rise in its cost of revenue, from $456 million in 2014 to $3.5 billion in 2023. This dramatic growth underscores the company's aggressive expansion and strategic acquisitions.
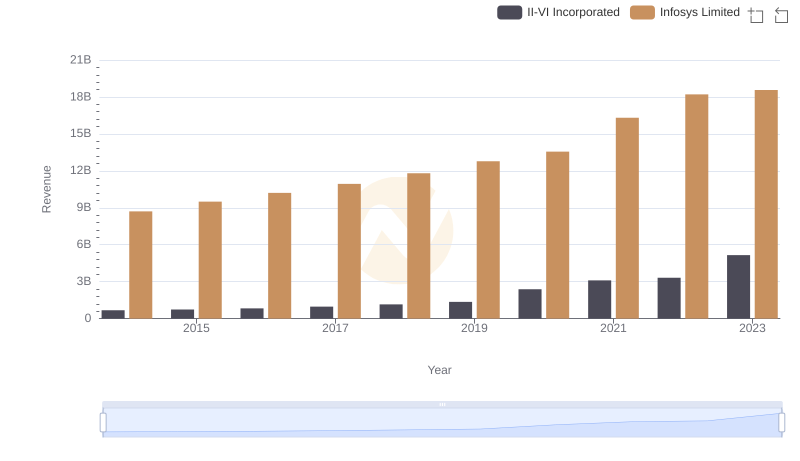
Comparing Revenue Performance: Infosys Limited or II-VI Incorporated?
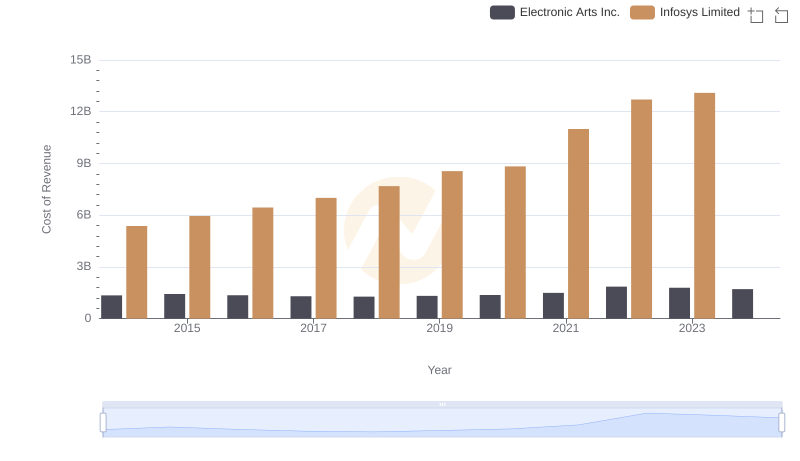
Analyzing Cost of Revenue: Infosys Limited and Electronic Arts Inc.
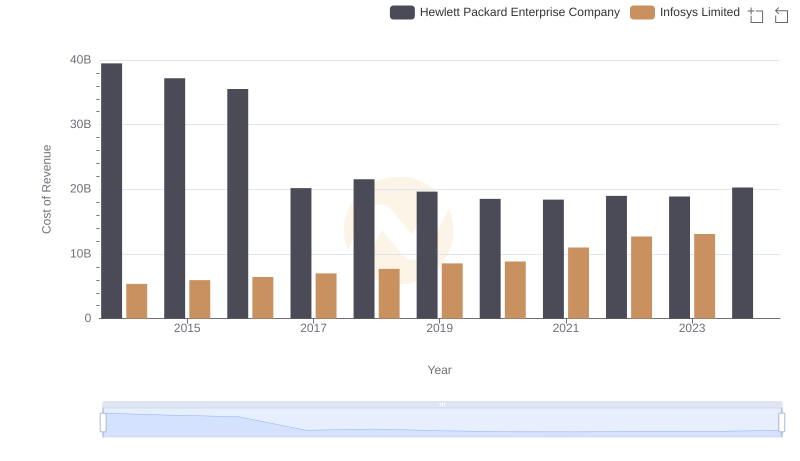
Cost of Revenue Comparison: Infosys Limited vs Hewlett Packard Enterprise Company
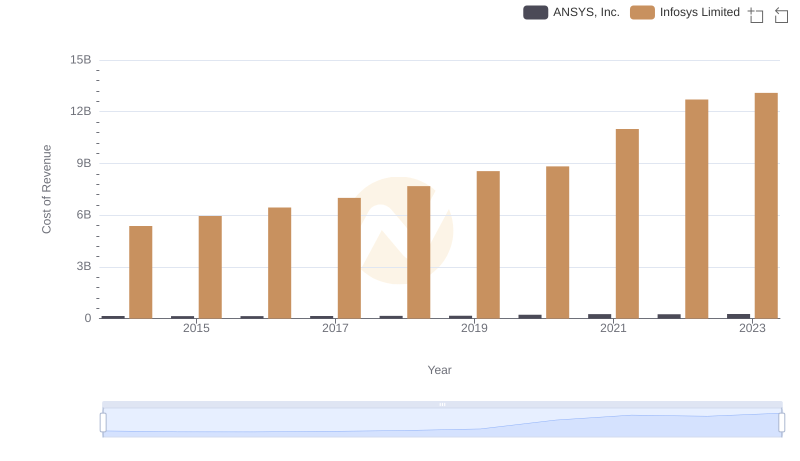
Cost of Revenue Trends: Infosys Limited vs ANSYS, Inc.
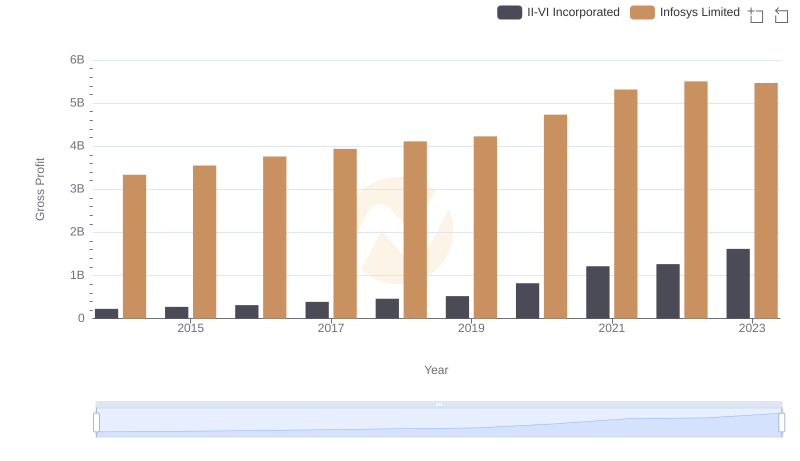
Key Insights on Gross Profit: Infosys Limited vs II-VI Incorporated
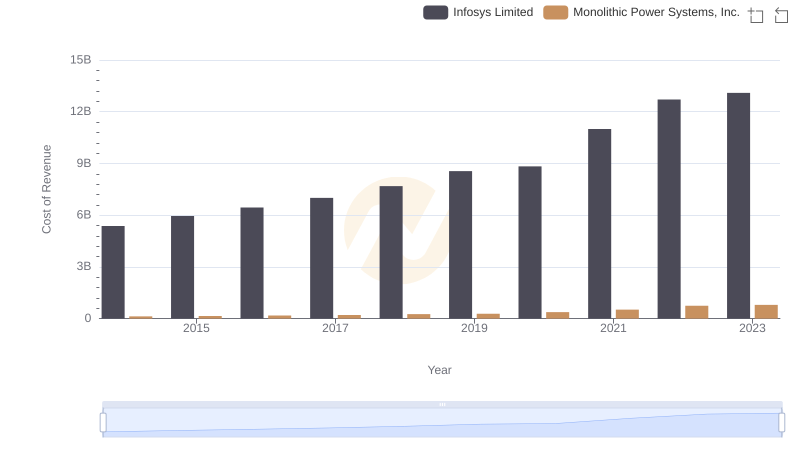
Analyzing Cost of Revenue: Infosys Limited and Monolithic Power Systems, Inc.
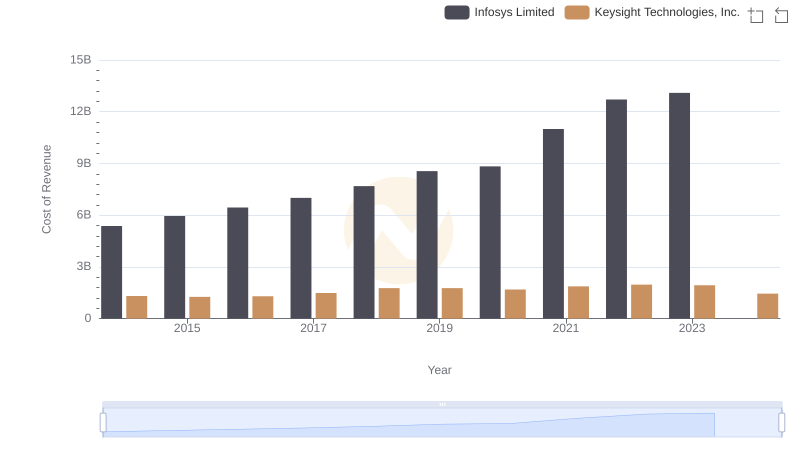
Cost Insights: Breaking Down Infosys Limited and Keysight Technologies, Inc.'s Expenses
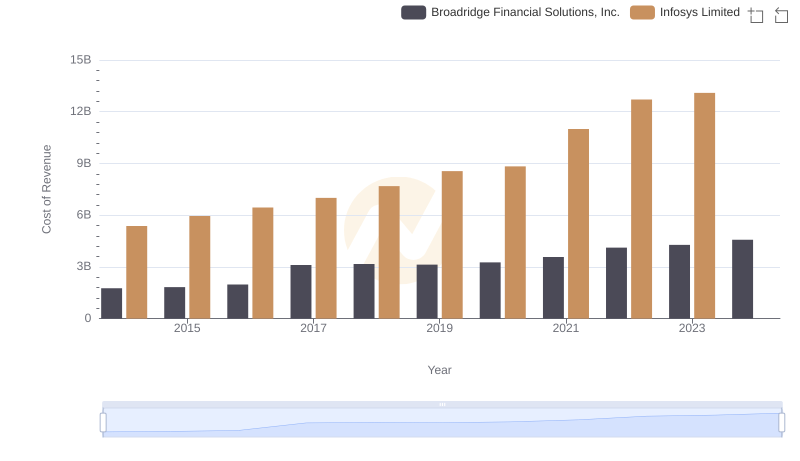
Comparing Cost of Revenue Efficiency: Infosys Limited vs Broadridge Financial Solutions, Inc.
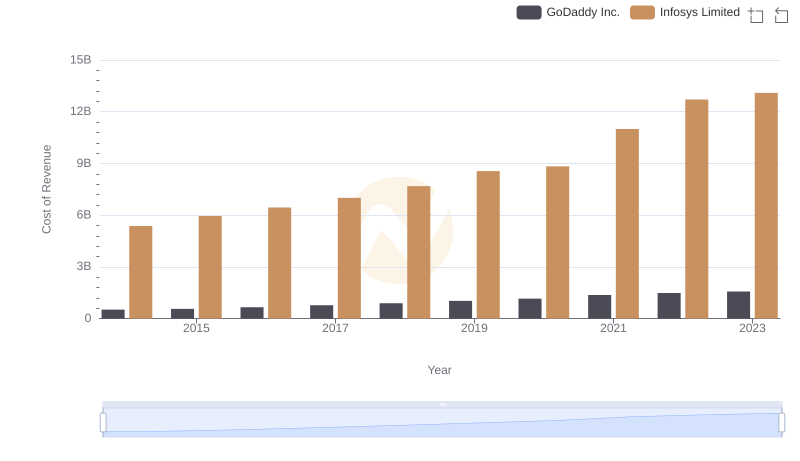
Cost of Revenue: Key Insights for Infosys Limited and GoDaddy Inc.
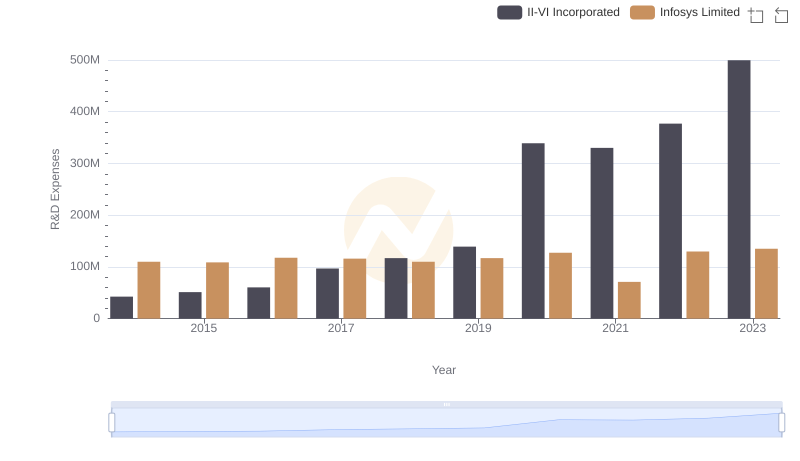
Comparing Innovation Spending: Infosys Limited and II-VI Incorporated
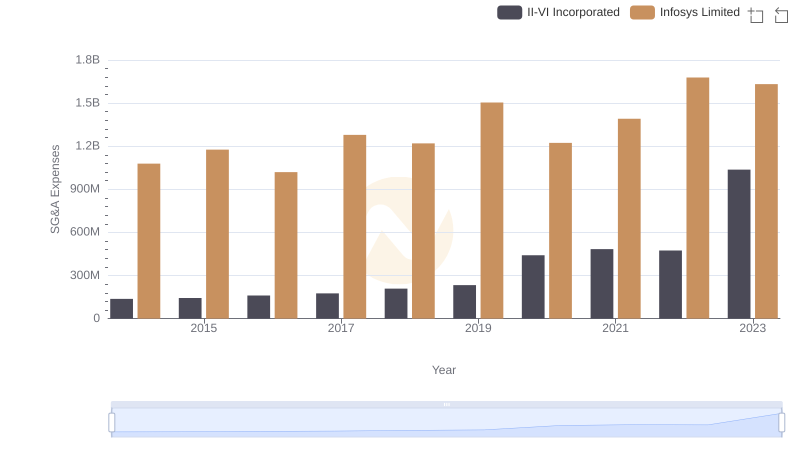
Cost Management Insights: SG&A Expenses for Infosys Limited and II-VI Incorporated
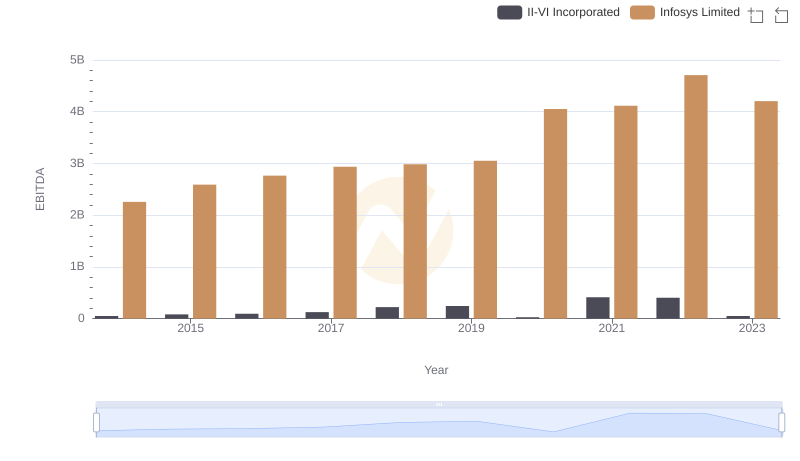
A Professional Review of EBITDA: Infosys Limited Compared to II-VI Incorporated