| __timestamp | Electronic Arts Inc. | Infosys Limited |
|---|---|---|
| Wednesday, January 1, 2014 | 1347000000 | 5374000000 |
| Thursday, January 1, 2015 | 1429000000 | 5950000000 |
| Friday, January 1, 2016 | 1354000000 | 6446000000 |
| Sunday, January 1, 2017 | 1298000000 | 7001000000 |
| Monday, January 1, 2018 | 1277000000 | 7687000000 |
| Tuesday, January 1, 2019 | 1322000000 | 8552000000 |
| Wednesday, January 1, 2020 | 1369000000 | 8828000000 |
| Friday, January 1, 2021 | 1494000000 | 10996000000 |
| Saturday, January 1, 2022 | 1859000000 | 12709000000 |
| Sunday, January 1, 2023 | 1792000000 | 13096000000 |
| Monday, January 1, 2024 | 1710000000 |
Unveiling the hidden dimensions of data
In the ever-evolving landscape of global business, understanding the cost of revenue is crucial for evaluating a company's financial health. This analysis delves into the cost of revenue trends for two industry giants: Infosys Limited, a leader in IT services, and Electronic Arts Inc., a titan in the gaming industry, from 2014 to 2023.
Over the past decade, Infosys Limited has seen a remarkable 144% increase in its cost of revenue, peaking at approximately $13.1 billion in 2023. This growth reflects the company's expanding operations and increased service delivery. In contrast, Electronic Arts Inc. experienced a more modest 27% rise, reaching around $1.8 billion in 2023, indicative of its strategic cost management in a competitive market.
While the data for 2024 is incomplete for Infosys, the trends observed provide a compelling narrative of growth and strategic financial management.
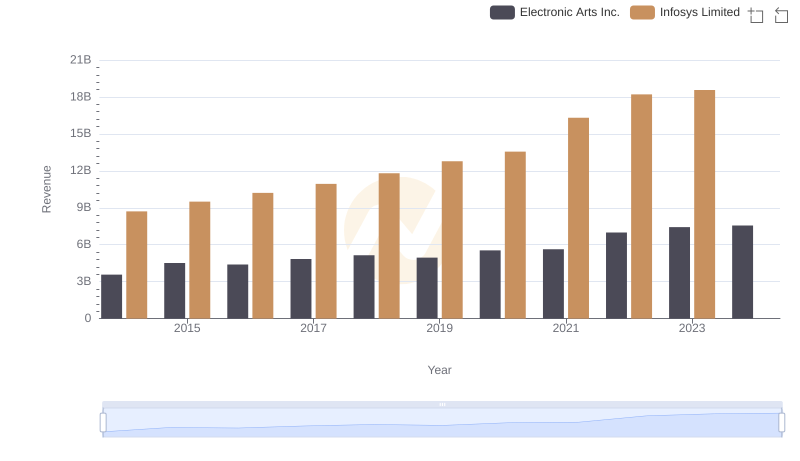
Infosys Limited vs Electronic Arts Inc.: Annual Revenue Growth Compared
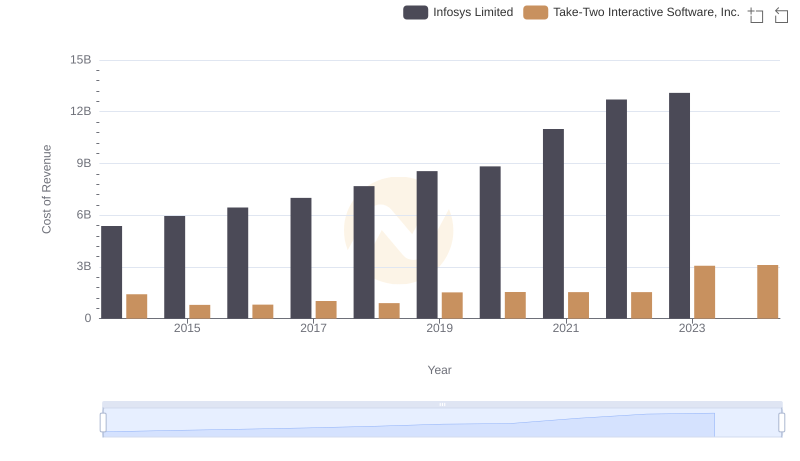
Analyzing Cost of Revenue: Infosys Limited and Take-Two Interactive Software, Inc.
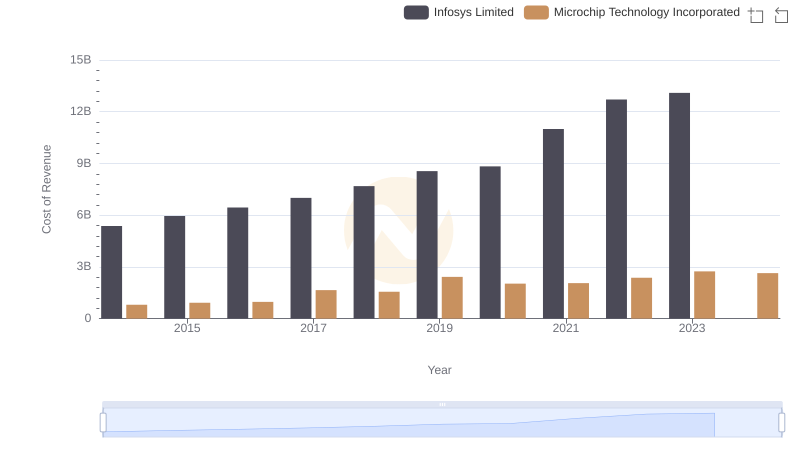
Cost Insights: Breaking Down Infosys Limited and Microchip Technology Incorporated's Expenses
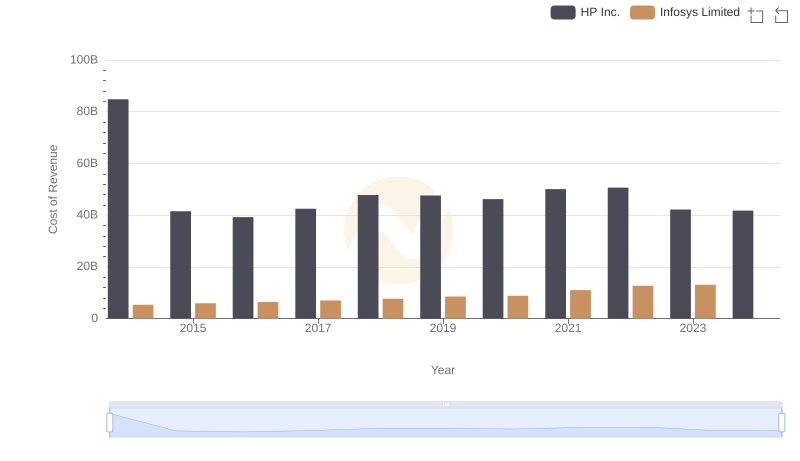
Analyzing Cost of Revenue: Infosys Limited and HP Inc.
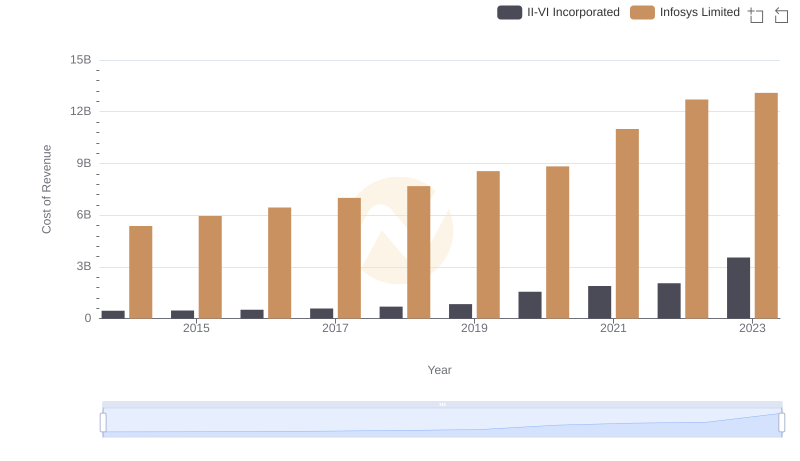
Analyzing Cost of Revenue: Infosys Limited and II-VI Incorporated
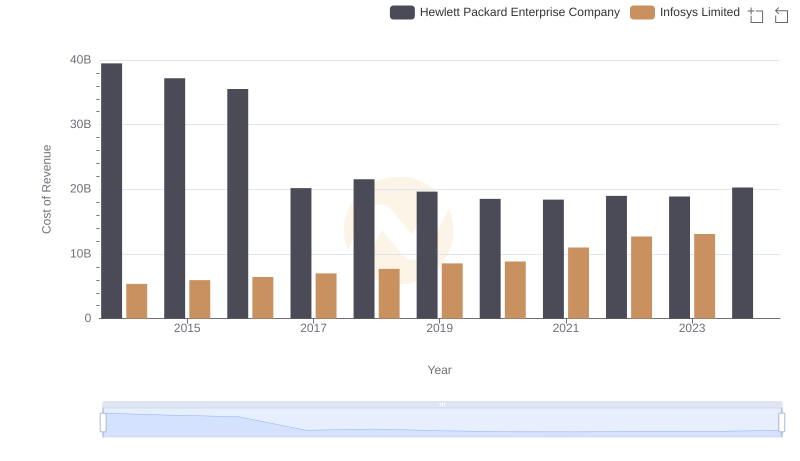
Cost of Revenue Comparison: Infosys Limited vs Hewlett Packard Enterprise Company
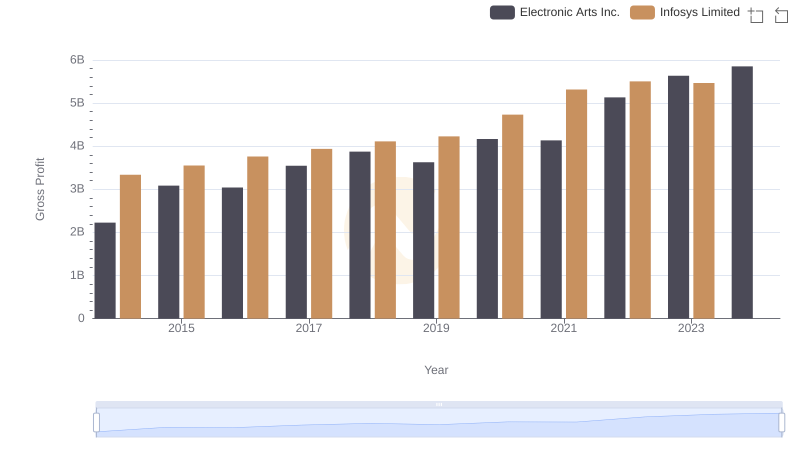
Who Generates Higher Gross Profit? Infosys Limited or Electronic Arts Inc.
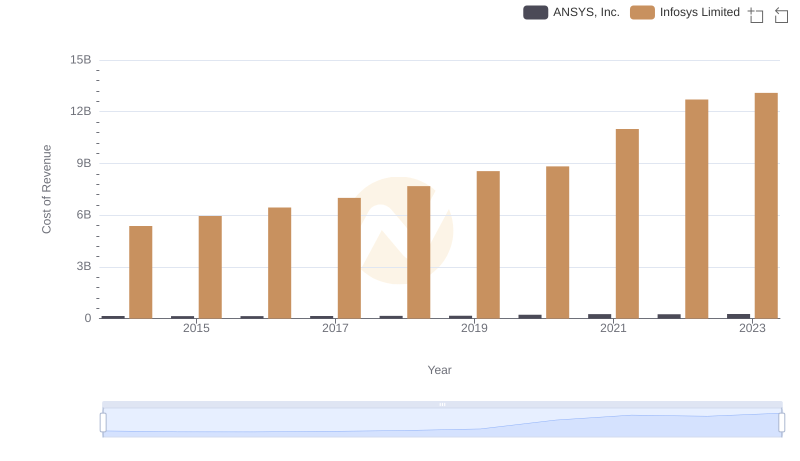
Cost of Revenue Trends: Infosys Limited vs ANSYS, Inc.
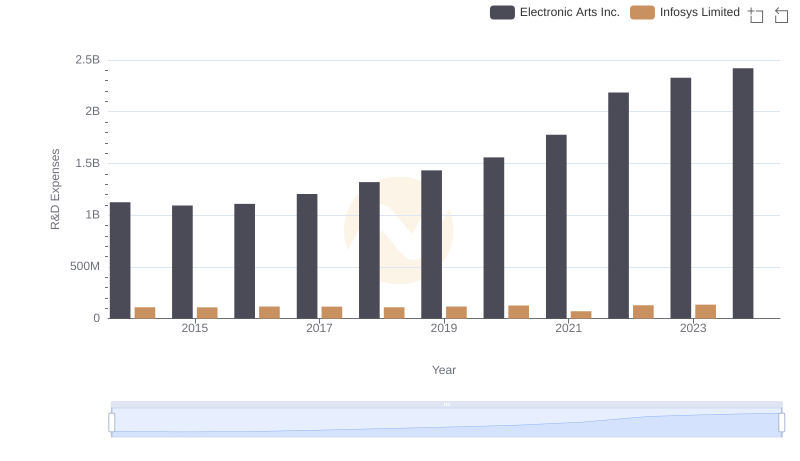
Comparing Innovation Spending: Infosys Limited and Electronic Arts Inc.
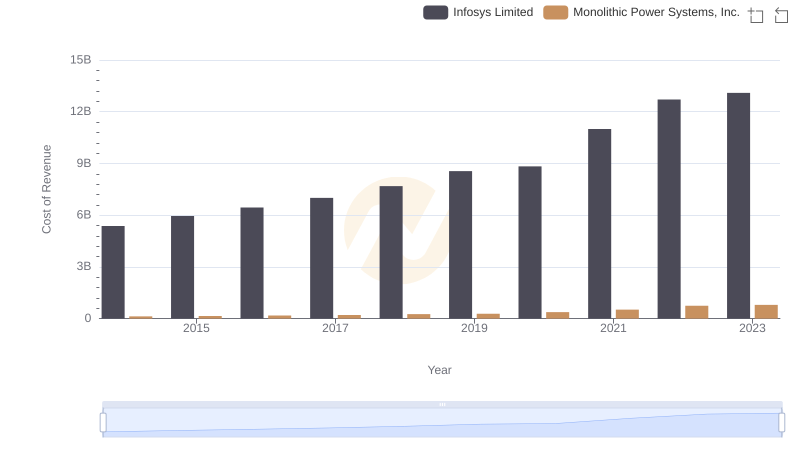
Analyzing Cost of Revenue: Infosys Limited and Monolithic Power Systems, Inc.
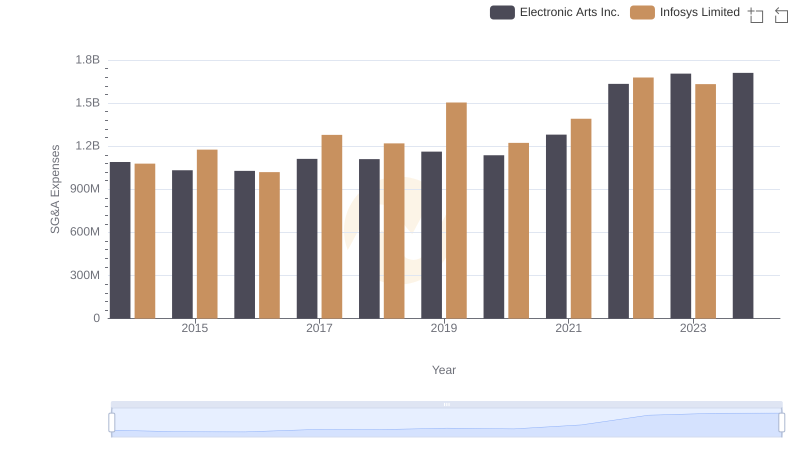
Infosys Limited or Electronic Arts Inc.: Who Manages SG&A Costs Better?
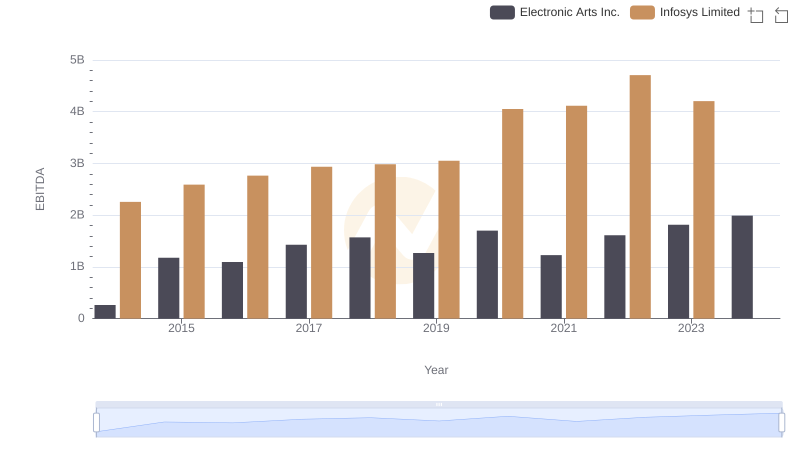
A Side-by-Side Analysis of EBITDA: Infosys Limited and Electronic Arts Inc.