| __timestamp | Infosys Limited | Monolithic Power Systems, Inc. |
|---|---|---|
| Wednesday, January 1, 2014 | 5374000000 | 129917000 |
| Thursday, January 1, 2015 | 5950000000 | 152898000 |
| Friday, January 1, 2016 | 6446000000 | 177792000 |
| Sunday, January 1, 2017 | 7001000000 | 212646000 |
| Monday, January 1, 2018 | 7687000000 | 259714000 |
| Tuesday, January 1, 2019 | 8552000000 | 281596000 |
| Wednesday, January 1, 2020 | 8828000000 | 378498000 |
| Friday, January 1, 2021 | 10996000000 | 522339000 |
| Saturday, January 1, 2022 | 12709000000 | 745596000 |
| Sunday, January 1, 2023 | 13096000000 | 799953000 |
Unlocking the unknown
In the ever-evolving landscape of global technology, Infosys Limited and Monolithic Power Systems, Inc. stand as intriguing case studies in cost management. From 2014 to 2023, Infosys Limited, a titan in the IT services sector, saw its cost of revenue grow by approximately 144%, reflecting its expansive operations and increasing service demands. In contrast, Monolithic Power Systems, Inc., a leader in semiconductor solutions, experienced a staggering 516% increase in cost of revenue over the same period, underscoring its rapid growth and innovation-driven strategy.
While Infosys's cost of revenue reached a peak of $13 billion in 2023, Monolithic Power Systems, Inc. capped at nearly $800 million, highlighting the scale difference between the two. This data not only showcases their financial trajectories but also offers insights into their strategic priorities and market positioning.
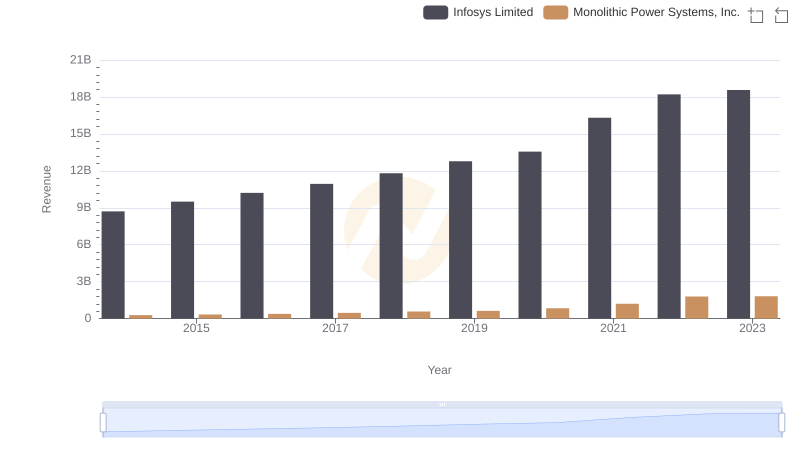
Infosys Limited vs Monolithic Power Systems, Inc.: Annual Revenue Growth Compared
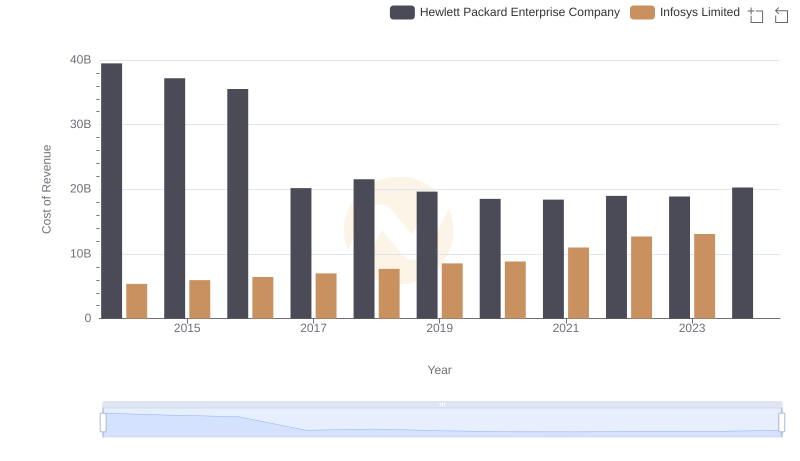
Cost of Revenue Comparison: Infosys Limited vs Hewlett Packard Enterprise Company
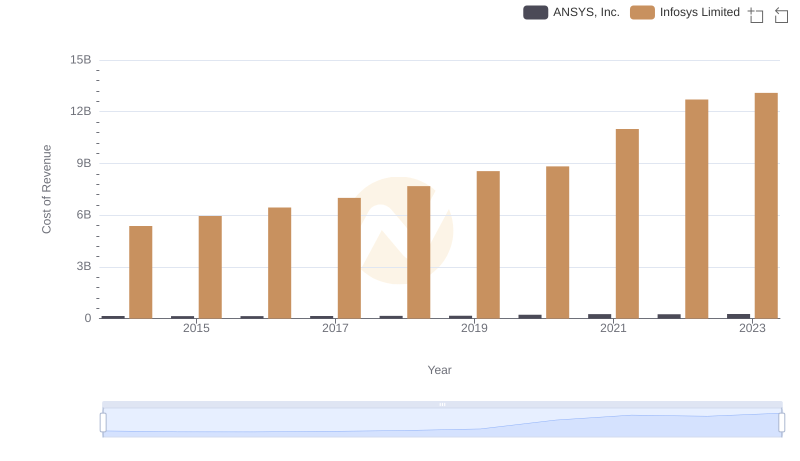
Cost of Revenue Trends: Infosys Limited vs ANSYS, Inc.
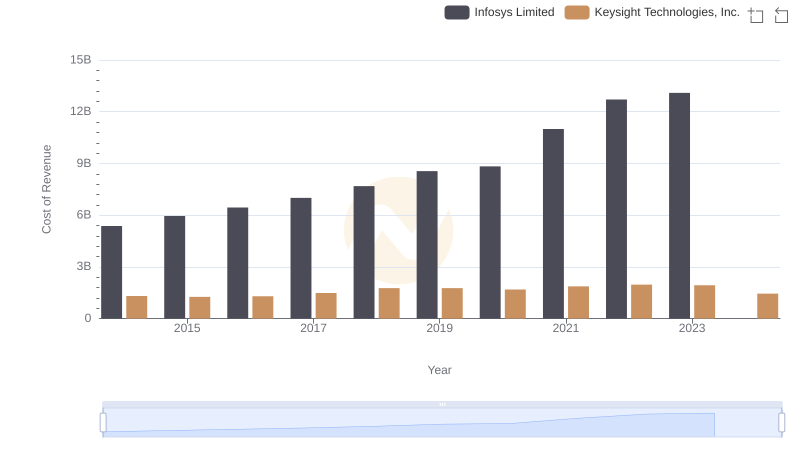
Cost Insights: Breaking Down Infosys Limited and Keysight Technologies, Inc.'s Expenses
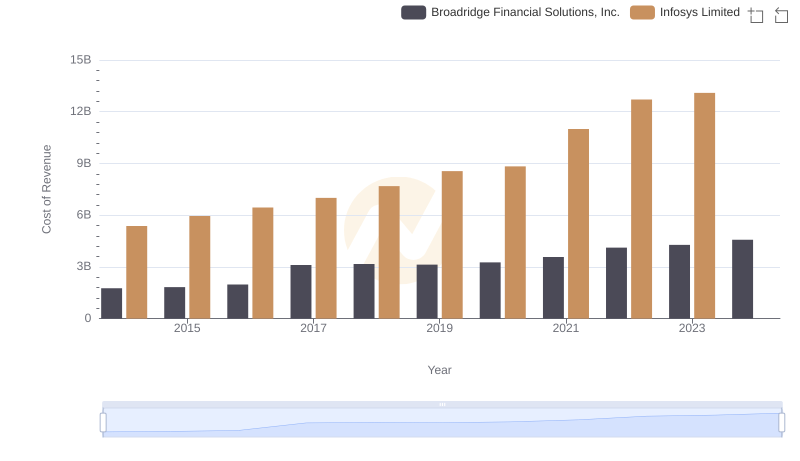
Comparing Cost of Revenue Efficiency: Infosys Limited vs Broadridge Financial Solutions, Inc.
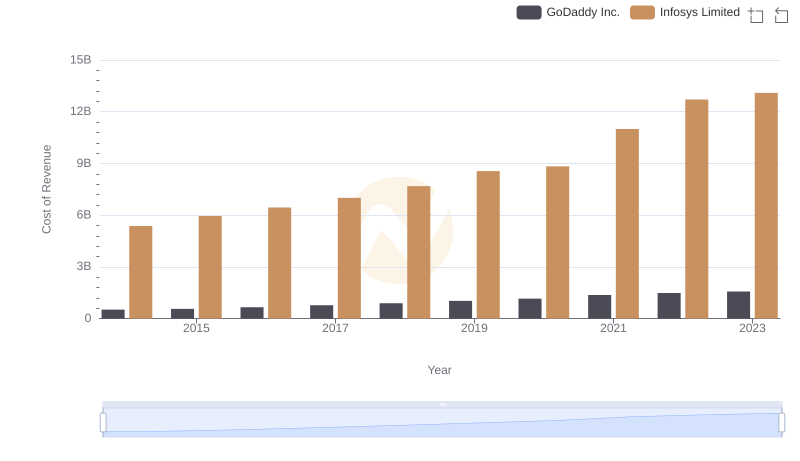
Cost of Revenue: Key Insights for Infosys Limited and GoDaddy Inc.
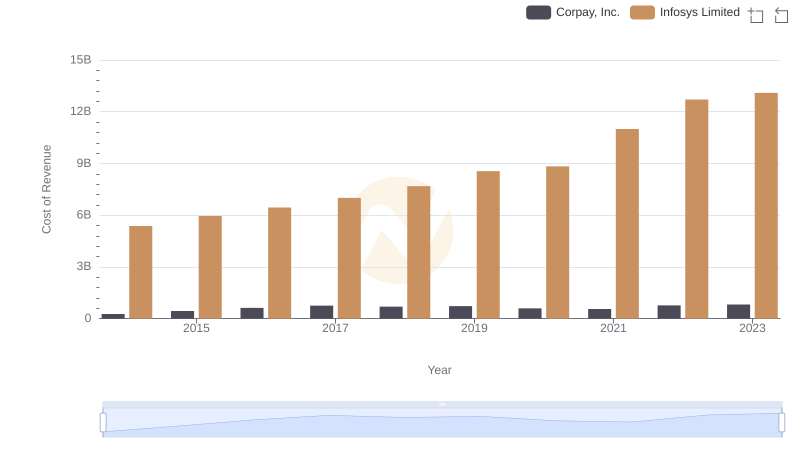
Analyzing Cost of Revenue: Infosys Limited and Corpay, Inc.
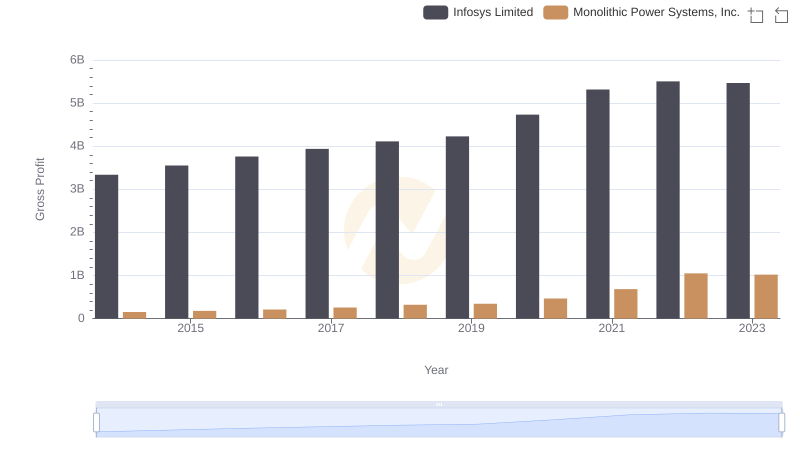
Infosys Limited and Monolithic Power Systems, Inc.: A Detailed Gross Profit Analysis
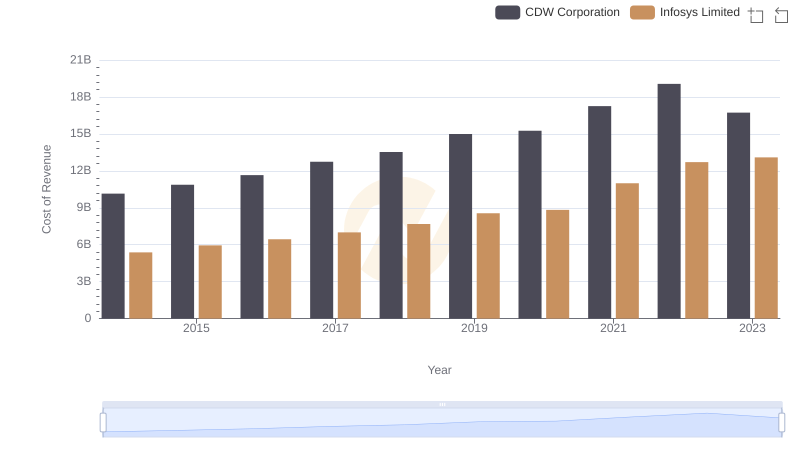
Cost of Revenue: Key Insights for Infosys Limited and CDW Corporation
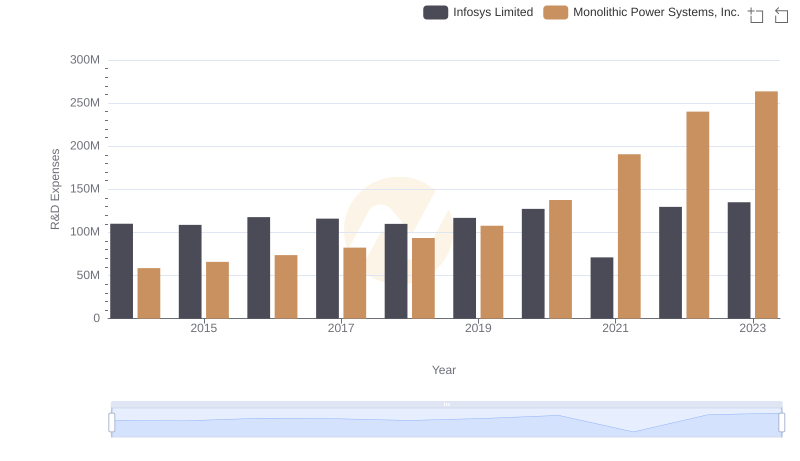
Infosys Limited or Monolithic Power Systems, Inc.: Who Invests More in Innovation?
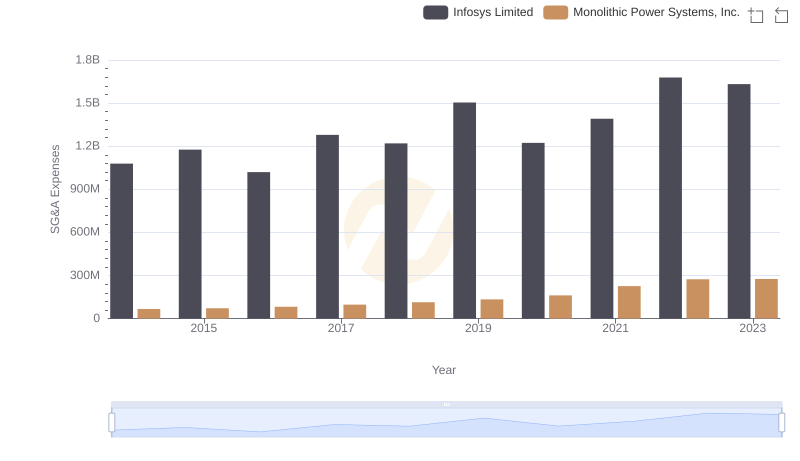
SG&A Efficiency Analysis: Comparing Infosys Limited and Monolithic Power Systems, Inc.
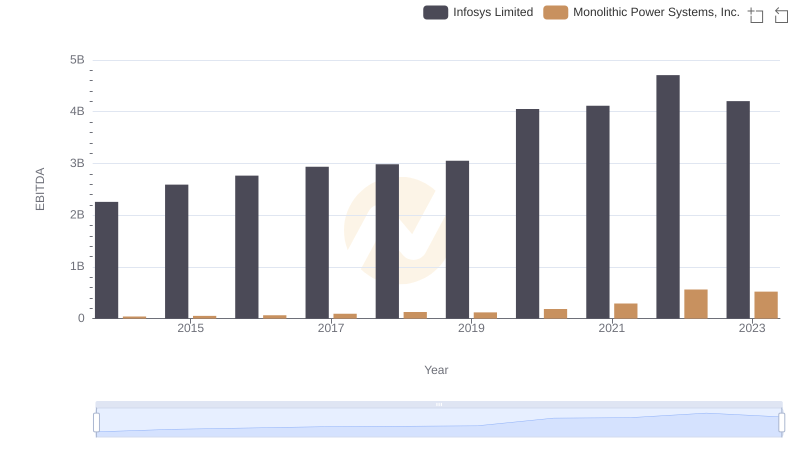
Comparative EBITDA Analysis: Infosys Limited vs Monolithic Power Systems, Inc.