| __timestamp | Global Payments Inc. | Nordson Corporation |
|---|---|---|
| Wednesday, January 1, 2014 | 2773718000 | 1704021000 |
| Thursday, January 1, 2015 | 2898150000 | 1688666000 |
| Friday, January 1, 2016 | 3370976000 | 1808994000 |
| Sunday, January 1, 2017 | 3975163000 | 2066982000 |
| Monday, January 1, 2018 | 3366366000 | 2254668000 |
| Tuesday, January 1, 2019 | 4911892000 | 2194226000 |
| Wednesday, January 1, 2020 | 7423558000 | 2121100000 |
| Friday, January 1, 2021 | 8523762000 | 2362209000 |
| Saturday, January 1, 2022 | 8975515000 | 2590278000 |
| Sunday, January 1, 2023 | 9654419000 | 2628632000 |
| Monday, January 1, 2024 | 10105894000 | 2689921000 |
Unleashing the power of data
In the ever-evolving landscape of global finance and industrial technology, Global Payments Inc. and Nordson Corporation stand as titans in their respective fields. Over the past decade, Global Payments Inc. has seen its revenue soar by approximately 248%, from $2.8 billion in 2014 to an impressive $9.7 billion in 2023. This growth underscores the company's strategic expansions and adaptability in the digital payment sector.
Conversely, Nordson Corporation, a leader in precision technology, has experienced a steady revenue increase of about 54% over the same period, reaching $2.6 billion in 2023. This consistent growth reflects Nordson's commitment to innovation and quality in manufacturing solutions.
While Global Payments Inc. shows a more aggressive growth trajectory, Nordson Corporation's steady rise highlights its resilience and market stability. The data for 2024 is incomplete, leaving room for speculation on future trends.
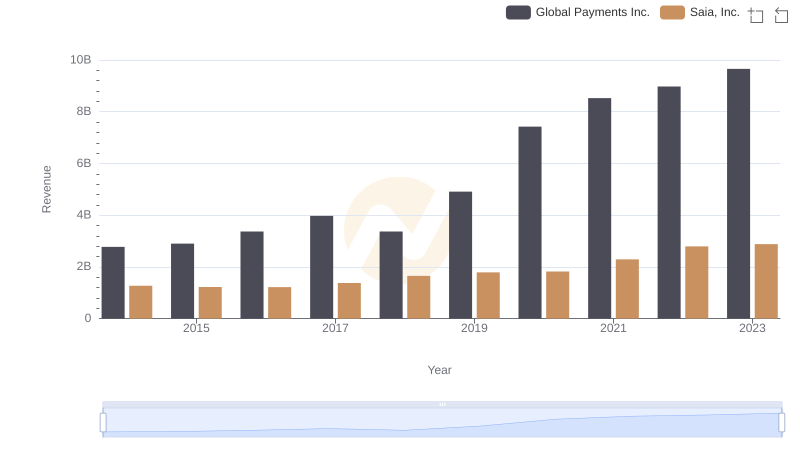
Global Payments Inc. and Saia, Inc.: A Comprehensive Revenue Analysis
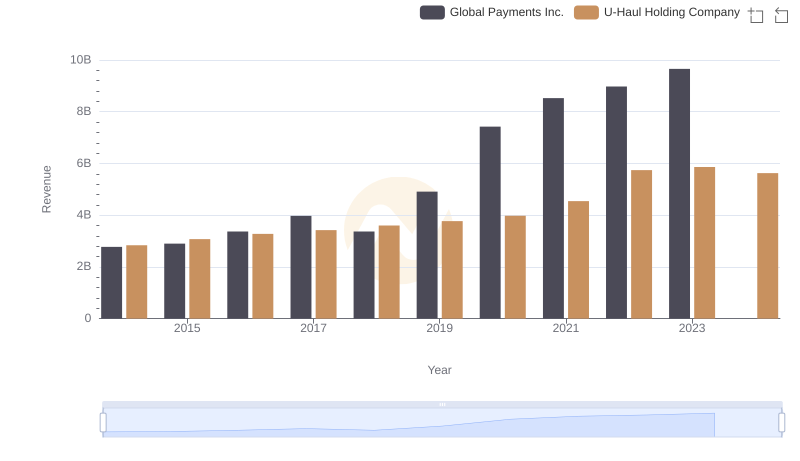
Comparing Revenue Performance: Global Payments Inc. or U-Haul Holding Company?
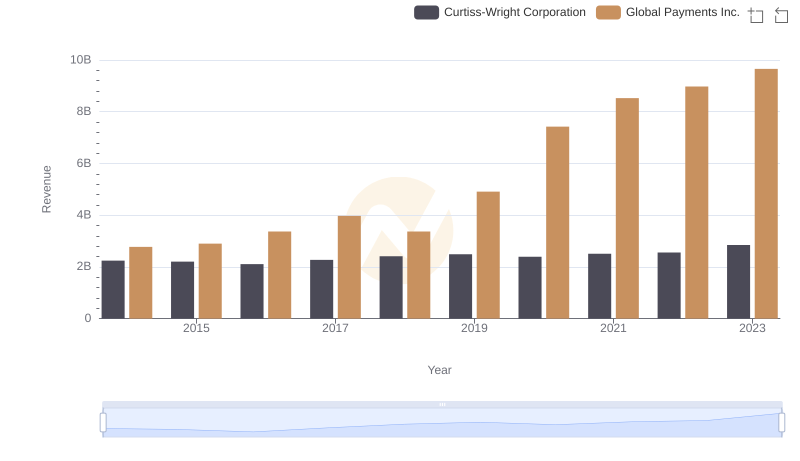
Annual Revenue Comparison: Global Payments Inc. vs Curtiss-Wright Corporation
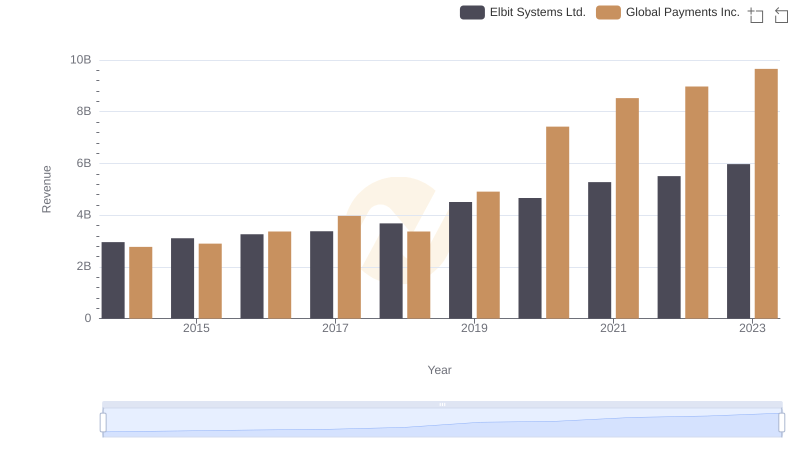
Global Payments Inc. vs Elbit Systems Ltd.: Annual Revenue Growth Compared

Breaking Down Revenue Trends: Global Payments Inc. vs C.H. Robinson Worldwide, Inc.
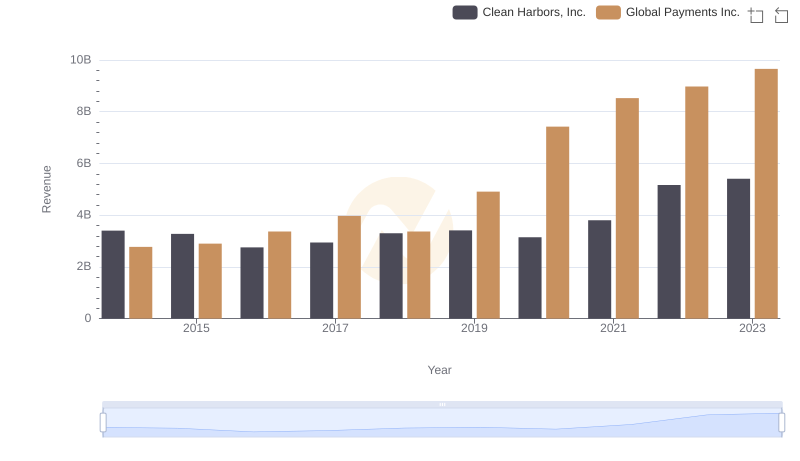
Global Payments Inc. or Clean Harbors, Inc.: Who Leads in Yearly Revenue?
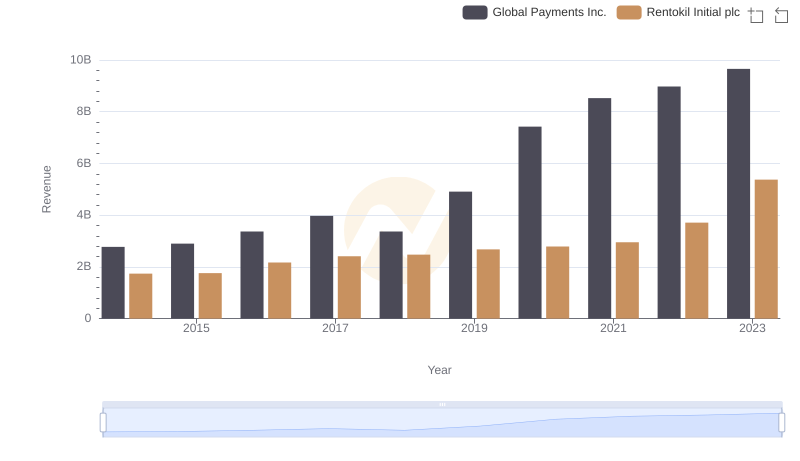
Global Payments Inc. or Rentokil Initial plc: Who Leads in Yearly Revenue?
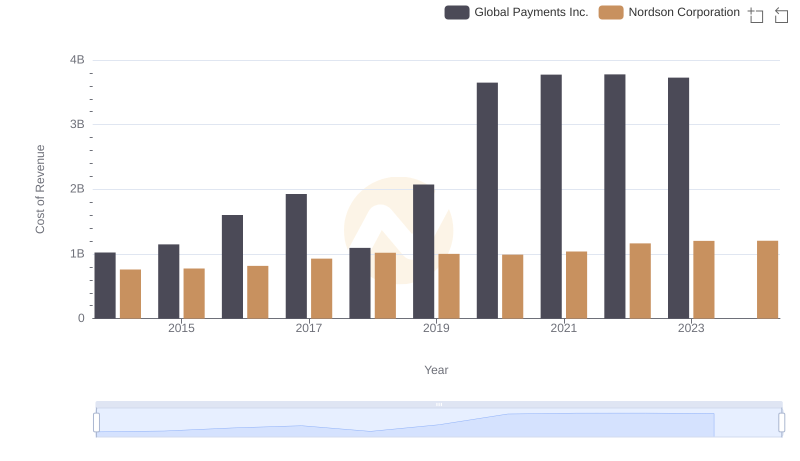
Cost of Revenue Trends: Global Payments Inc. vs Nordson Corporation
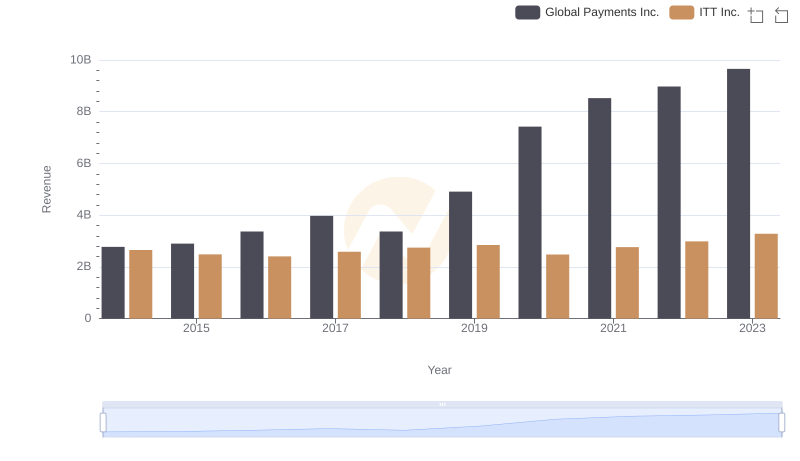
Global Payments Inc. vs ITT Inc.: Examining Key Revenue Metrics