| __timestamp | C.H. Robinson Worldwide, Inc. | Global Payments Inc. |
|---|---|---|
| Wednesday, January 1, 2014 | 805427000 | 594102000 |
| Thursday, January 1, 2015 | 924719000 | 618109000 |
| Friday, January 1, 2016 | 912200000 | 748136000 |
| Sunday, January 1, 2017 | 868096000 | 1010019000 |
| Monday, January 1, 2018 | 1008812000 | 1315968000 |
| Tuesday, January 1, 2019 | 890425000 | 1764994000 |
| Wednesday, January 1, 2020 | 774995000 | 2508393000 |
| Friday, January 1, 2021 | 1173367000 | 3233589000 |
| Saturday, January 1, 2022 | 1359558000 | 2427684000 |
| Sunday, January 1, 2023 | 613592000 | 3606789000 |
| Monday, January 1, 2024 | 766301000 | 2333605000 |
Igniting the spark of knowledge
In the ever-evolving landscape of global commerce, understanding the financial health of key players is crucial. This analysis delves into the EBITDA trends of Global Payments Inc. and C.H. Robinson Worldwide, Inc. from 2014 to 2023. Over this period, Global Payments Inc. has shown a remarkable growth trajectory, with EBITDA increasing by over 500%, peaking in 2023. In contrast, C.H. Robinson Worldwide, Inc. experienced a more modest growth, with a peak in 2022 before a significant drop in 2023. This divergence highlights the dynamic nature of the financial services and logistics sectors. Notably, the data for 2024 is incomplete, indicating potential shifts in the coming year. As businesses navigate post-pandemic recovery, these insights offer a glimpse into strategic positioning and resilience in the face of economic challenges.

Breaking Down Revenue Trends: Global Payments Inc. vs C.H. Robinson Worldwide, Inc.
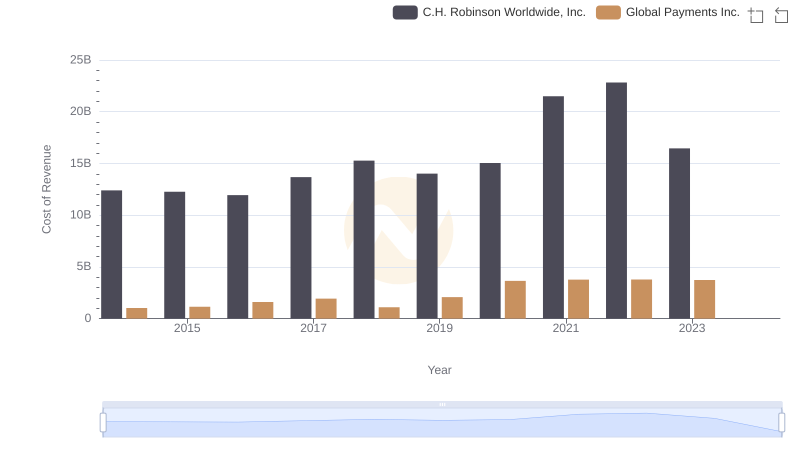
Cost of Revenue Trends: Global Payments Inc. vs C.H. Robinson Worldwide, Inc.
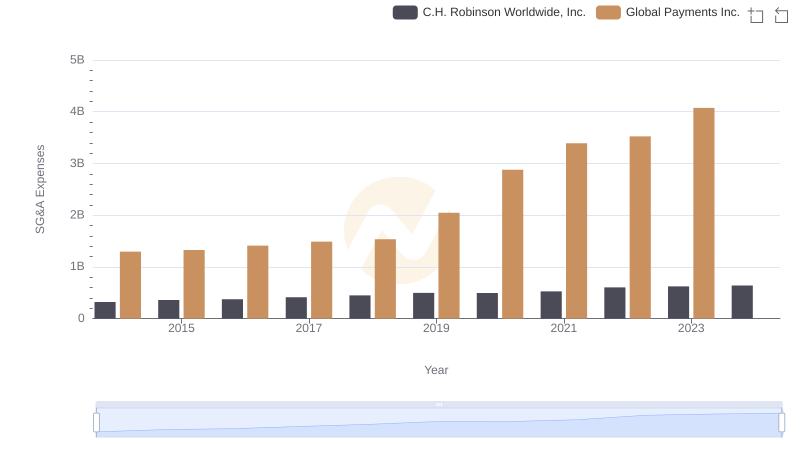
Who Optimizes SG&A Costs Better? Global Payments Inc. or C.H. Robinson Worldwide, Inc.

EBITDA Metrics Evaluated: Global Payments Inc. vs Elbit Systems Ltd.
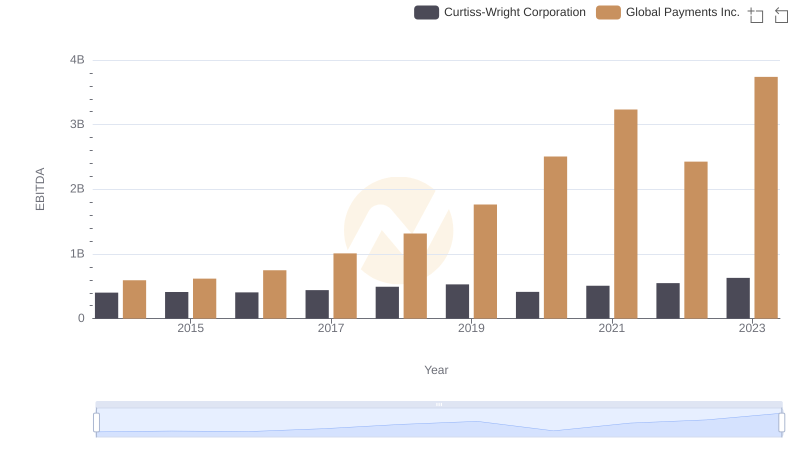
Professional EBITDA Benchmarking: Global Payments Inc. vs Curtiss-Wright Corporation