| __timestamp | Cisco Systems, Inc. | Motorola Solutions, Inc. |
|---|---|---|
| Wednesday, January 1, 2014 | 19373000000 | 3050000000 |
| Thursday, January 1, 2015 | 19480000000 | 2976000000 |
| Friday, January 1, 2016 | 18287000000 | 3169000000 |
| Sunday, January 1, 2017 | 17781000000 | 3356000000 |
| Monday, January 1, 2018 | 18724000000 | 3863000000 |
| Tuesday, January 1, 2019 | 19238000000 | 3956000000 |
| Wednesday, January 1, 2020 | 17618000000 | 3806000000 |
| Friday, January 1, 2021 | 17924000000 | 4131000000 |
| Saturday, January 1, 2022 | 19309000000 | 4883000000 |
| Sunday, January 1, 2023 | 21245000000 | 5008000000 |
| Monday, January 1, 2024 | 18975000000 | 5305000000 |
In pursuit of knowledge
In the ever-evolving tech landscape, understanding cost structures is crucial. Over the past decade, Cisco Systems, Inc. and Motorola Solutions, Inc. have showcased distinct cost of revenue trends. Cisco's cost of revenue has seen a modest decline of approximately 2% from 2014 to 2023, with a notable peak in 2023. In contrast, Motorola's costs have surged by nearly 64% over the same period, reflecting strategic shifts and market adaptations.
These insights offer a window into the financial strategies of two tech giants, highlighting their responses to market demands and operational challenges.
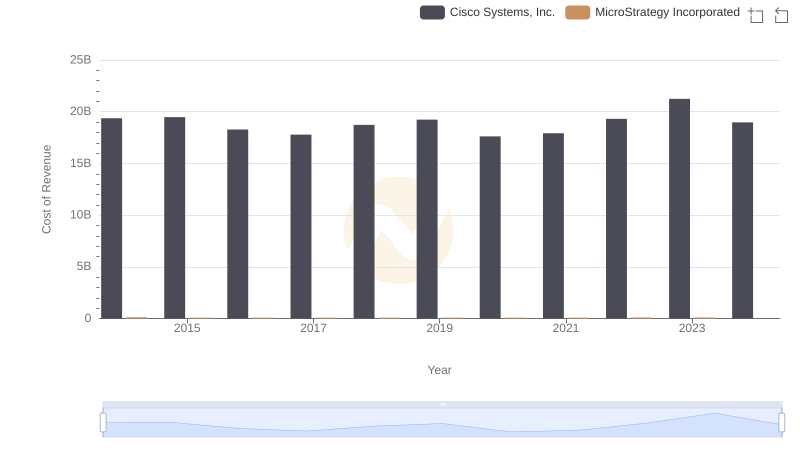
Cost of Revenue: Key Insights for Cisco Systems, Inc. and MicroStrategy Incorporated
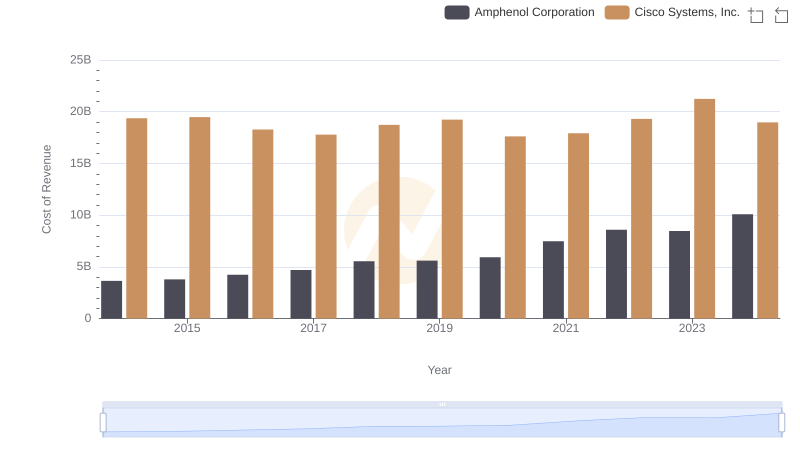
Cost of Revenue Trends: Cisco Systems, Inc. vs Amphenol Corporation
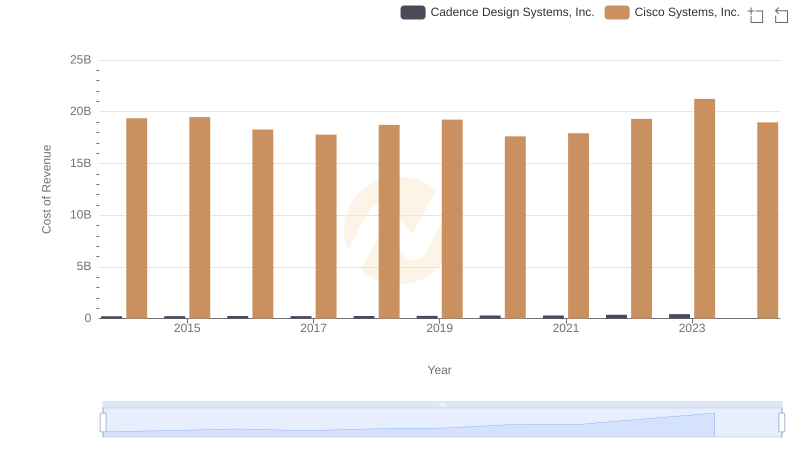
Cost of Revenue: Key Insights for Cisco Systems, Inc. and Cadence Design Systems, Inc.
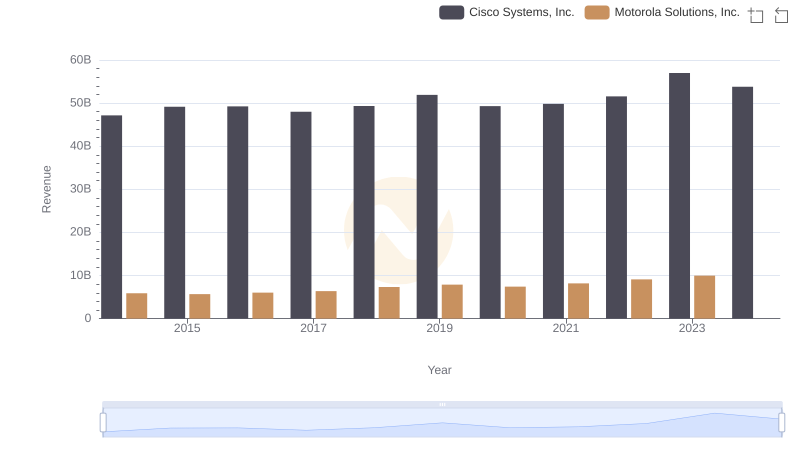
Revenue Insights: Cisco Systems, Inc. and Motorola Solutions, Inc. Performance Compared
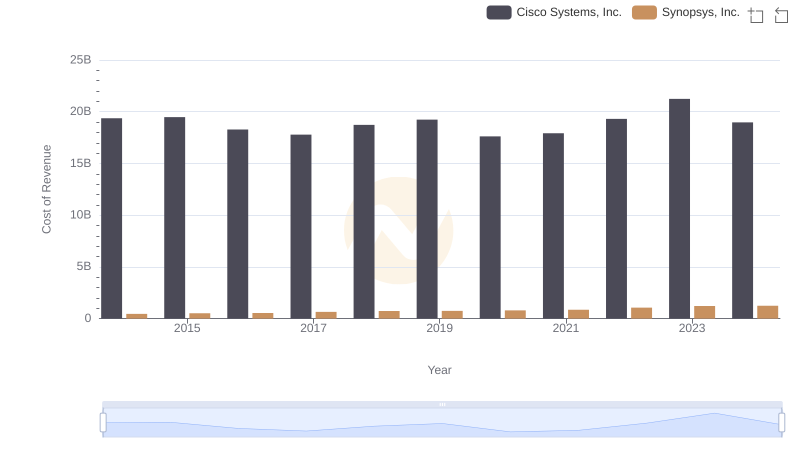
Cost of Revenue: Key Insights for Cisco Systems, Inc. and Synopsys, Inc.
Comparing Cost of Revenue Efficiency: Cisco Systems, Inc. vs Fortinet, Inc.
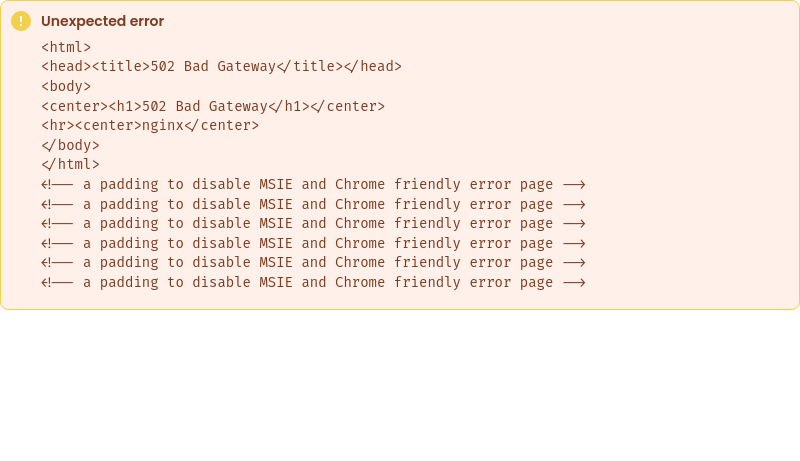
Cost of Revenue: Key Insights for Cisco Systems, Inc. and Workday, Inc.
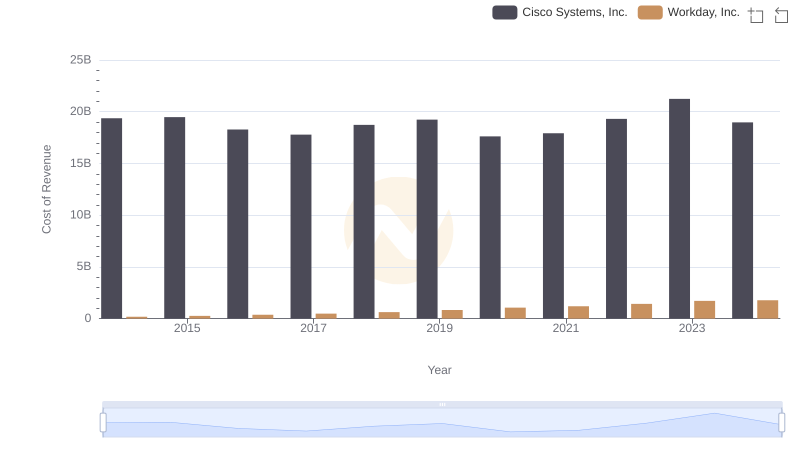
Cost of Revenue: Key Insights for Cisco Systems, Inc. and Dell Technologies Inc.
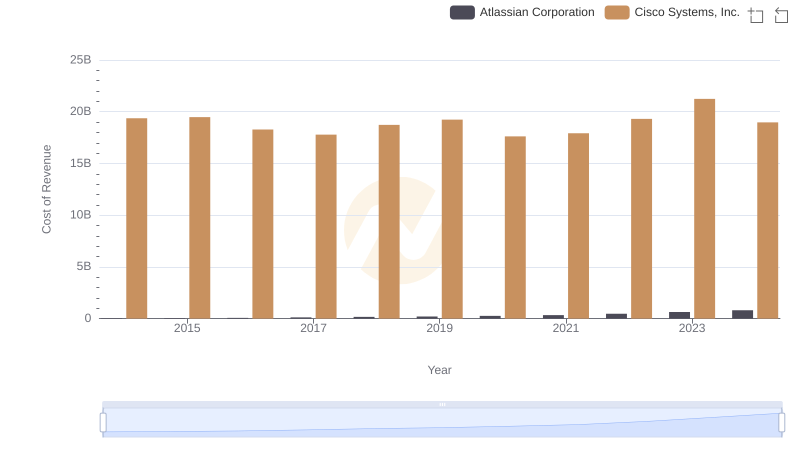
Cost of Revenue Comparison: Cisco Systems, Inc. vs Atlassian Corporation
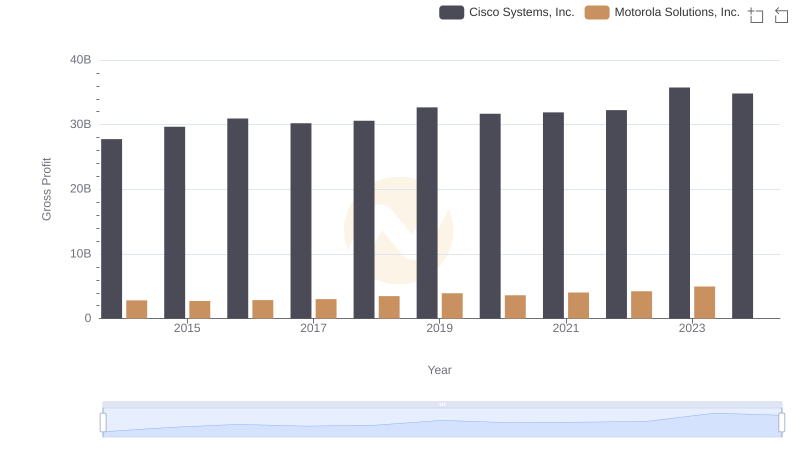
Cisco Systems, Inc. and Motorola Solutions, Inc.: A Detailed Gross Profit Analysis
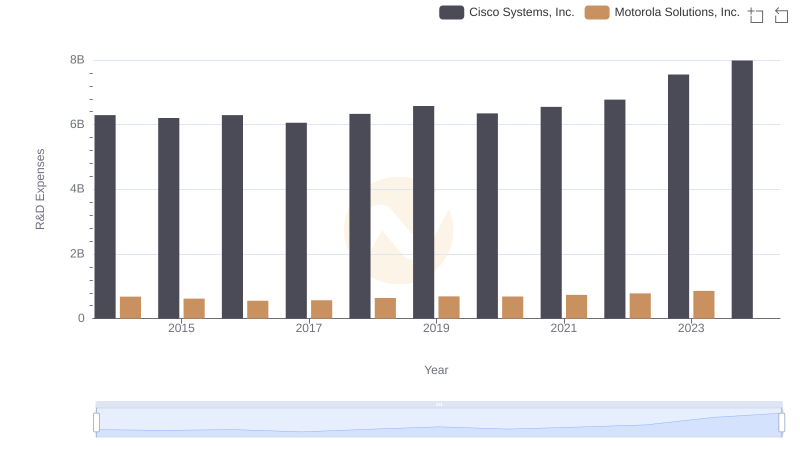
Research and Development Expenses Breakdown: Cisco Systems, Inc. vs Motorola Solutions, Inc.
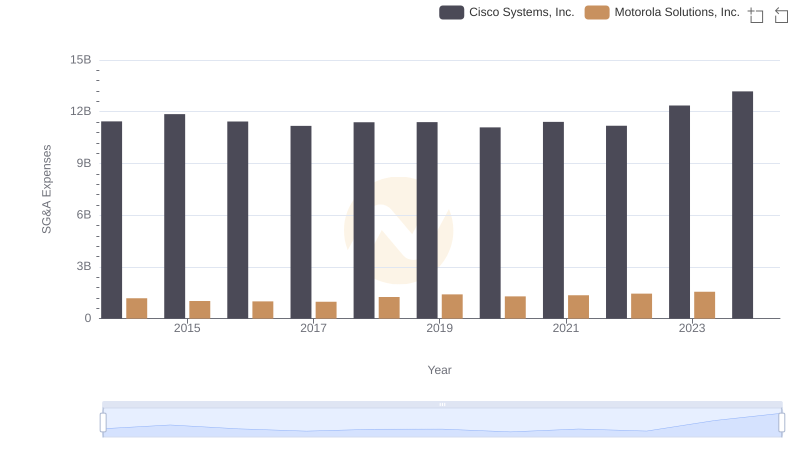
Cisco Systems, Inc. or Motorola Solutions, Inc.: Who Manages SG&A Costs Better?