| __timestamp | Cisco Systems, Inc. | Synopsys, Inc. |
|---|---|---|
| Wednesday, January 1, 2014 | 19373000000 | 456885000 |
| Thursday, January 1, 2015 | 19480000000 | 518920000 |
| Friday, January 1, 2016 | 18287000000 | 542962000 |
| Sunday, January 1, 2017 | 17781000000 | 654184000 |
| Monday, January 1, 2018 | 18724000000 | 735898000 |
| Tuesday, January 1, 2019 | 19238000000 | 752946000 |
| Wednesday, January 1, 2020 | 17618000000 | 794690000 |
| Friday, January 1, 2021 | 17924000000 | 861777000 |
| Saturday, January 1, 2022 | 19309000000 | 1063697000 |
| Sunday, January 1, 2023 | 21245000000 | 1222193000 |
| Monday, January 1, 2024 | 18975000000 | 1245289000 |
Unleashing the power of data
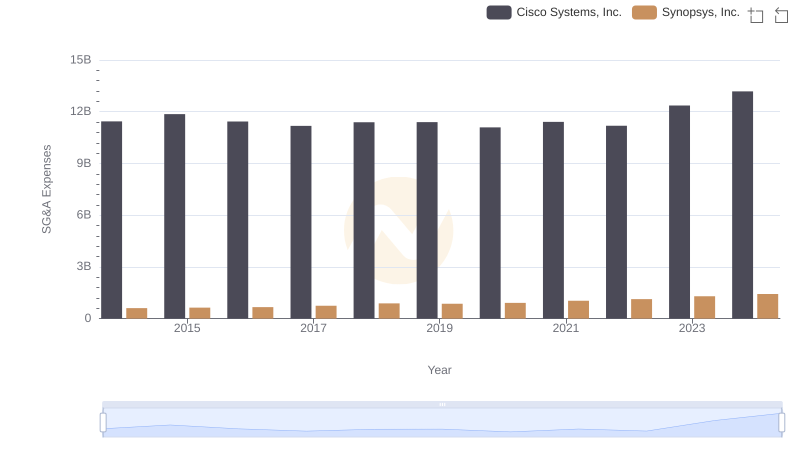
In the ever-evolving tech industry, understanding cost structures is crucial for investors and analysts. Cisco Systems, Inc. and Synopsys, Inc. have shown distinct trends in their cost of revenue from 2014 to 2024. Cisco's cost of revenue has fluctuated, peaking in 2023 with a 10% increase from 2014, reflecting strategic investments and market dynamics. In contrast, Synopsys has experienced a steady rise, with a remarkable 172% increase over the same period, indicating robust growth and efficient cost management.
Cisco's cost of revenue saw a dip in 2020, likely due to global economic challenges, but rebounded strongly by 2023. Meanwhile, Synopsys's consistent upward trend highlights its expanding market presence and operational efficiency. These insights provide a window into the financial health and strategic direction of these tech giants, offering valuable perspectives for stakeholders.
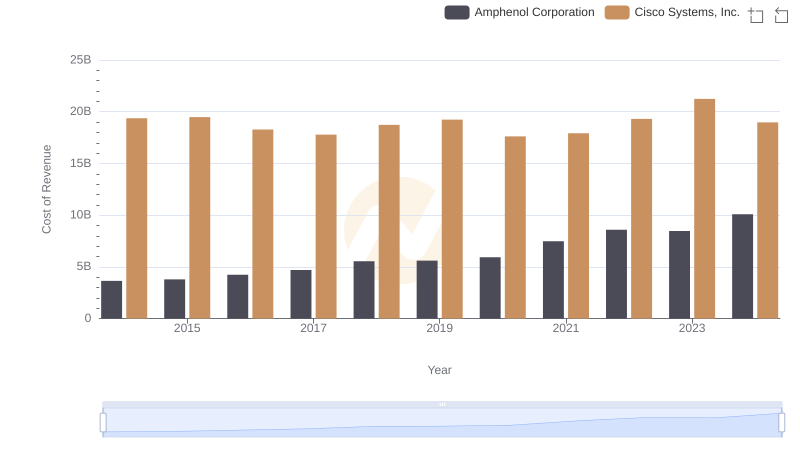
Cost of Revenue Trends: Cisco Systems, Inc. vs Amphenol Corporation
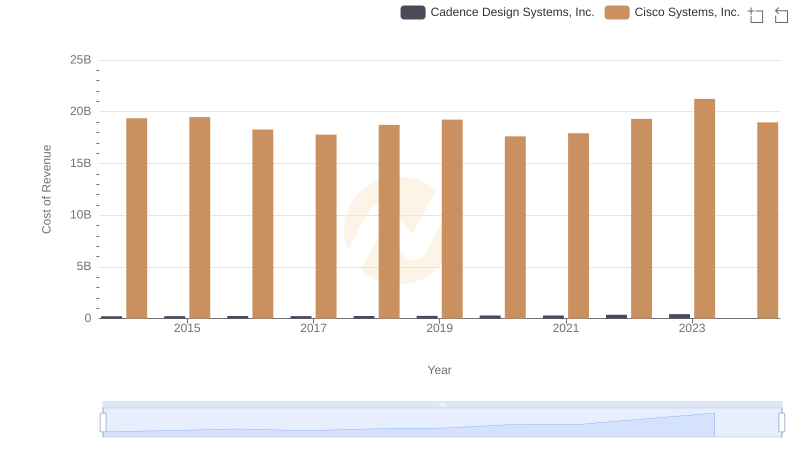
Cost of Revenue: Key Insights for Cisco Systems, Inc. and Cadence Design Systems, Inc.

Cisco Systems, Inc. vs Synopsys, Inc.: Annual Revenue Growth Compared
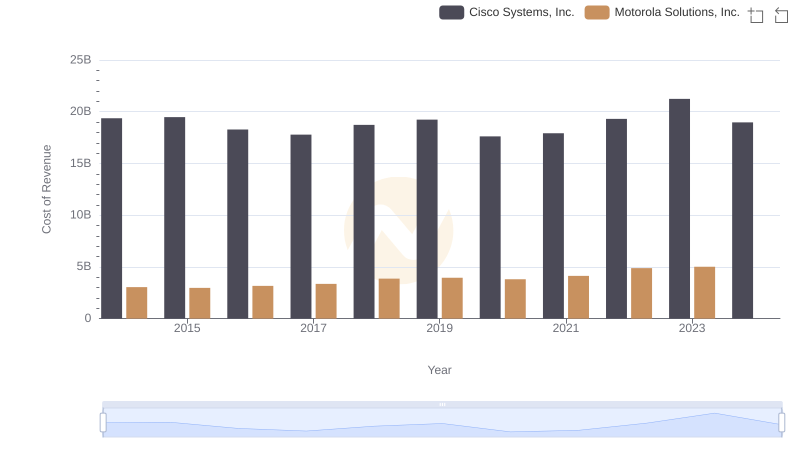
Cost of Revenue Comparison: Cisco Systems, Inc. vs Motorola Solutions, Inc.
Comparing Cost of Revenue Efficiency: Cisco Systems, Inc. vs Fortinet, Inc.
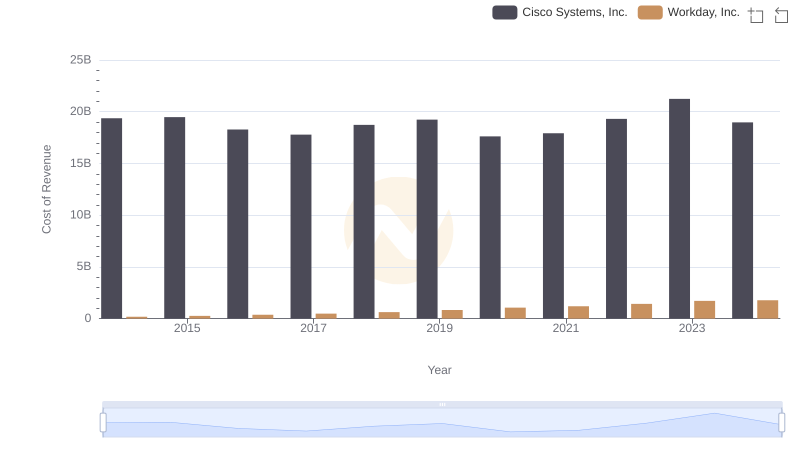
Cost of Revenue: Key Insights for Cisco Systems, Inc. and Workday, Inc.
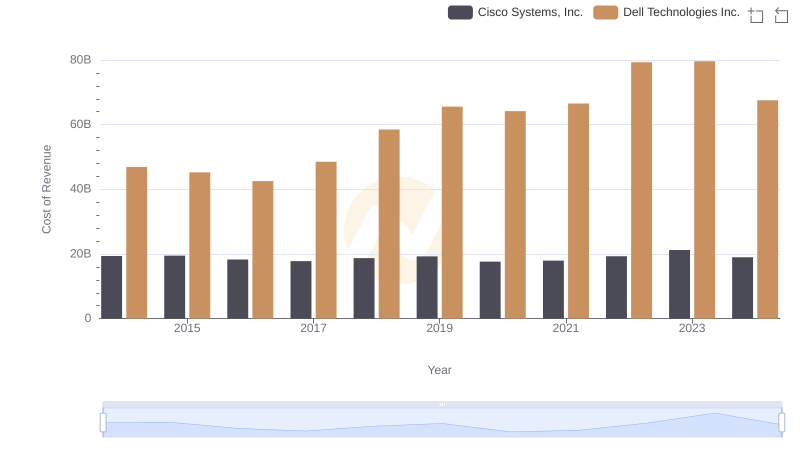
Cost of Revenue: Key Insights for Cisco Systems, Inc. and Dell Technologies Inc.
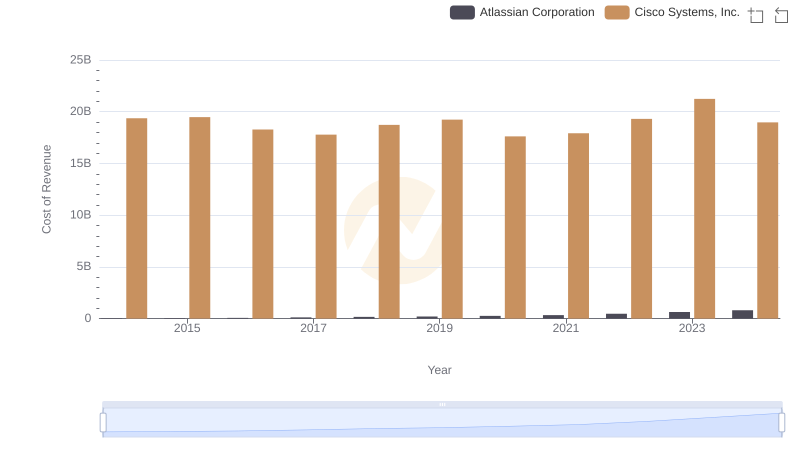
Cost of Revenue Comparison: Cisco Systems, Inc. vs Atlassian Corporation

Cisco Systems, Inc. vs Synopsys, Inc.: A Gross Profit Performance Breakdown

Research and Development Expenses Breakdown: Cisco Systems, Inc. vs Synopsys, Inc.
Who Optimizes SG&A Costs Better? Cisco Systems, Inc. or Synopsys, Inc.
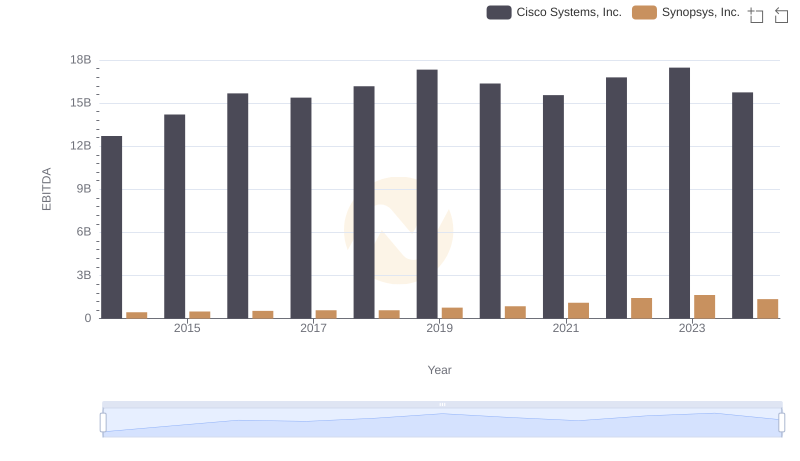
Comparative EBITDA Analysis: Cisco Systems, Inc. vs Synopsys, Inc.