| __timestamp | Axon Enterprise, Inc. | HEICO Corporation |
|---|---|---|
| Wednesday, January 1, 2014 | 62977000 | 733999000 |
| Thursday, January 1, 2015 | 69245000 | 754469000 |
| Friday, January 1, 2016 | 97709000 | 860766000 |
| Sunday, January 1, 2017 | 136710000 | 950088000 |
| Monday, January 1, 2018 | 161485000 | 1087006000 |
| Tuesday, January 1, 2019 | 223574000 | 1241807000 |
| Wednesday, January 1, 2020 | 264672000 | 1104882000 |
| Friday, January 1, 2021 | 322471000 | 1138259000 |
| Saturday, January 1, 2022 | 461297000 | 1345563000 |
| Sunday, January 1, 2023 | 608009000 | 1814617000 |
| Monday, January 1, 2024 | 2355943000 |
Data in motion
In the ever-evolving landscape of the defense and aerospace sectors, understanding cost dynamics is crucial. From 2014 to 2023, Axon Enterprise, Inc. and HEICO Corporation have shown distinct trajectories in their cost of revenue. Axon Enterprise, Inc. has seen a remarkable increase, with costs rising nearly tenfold from approximately $63 million in 2014 to over $608 million in 2023. This reflects a robust growth strategy and expanding operations. In contrast, HEICO Corporation, a stalwart in aerospace, has maintained a steady upward trend, with costs increasing from around $734 million in 2014 to $1.8 billion in 2023, marking a 147% rise. This steady growth underscores HEICO's consistent market presence and operational efficiency. Notably, 2024 data for Axon is missing, highlighting potential data gaps. These trends offer valuable insights into the financial strategies and market positioning of these industry leaders.
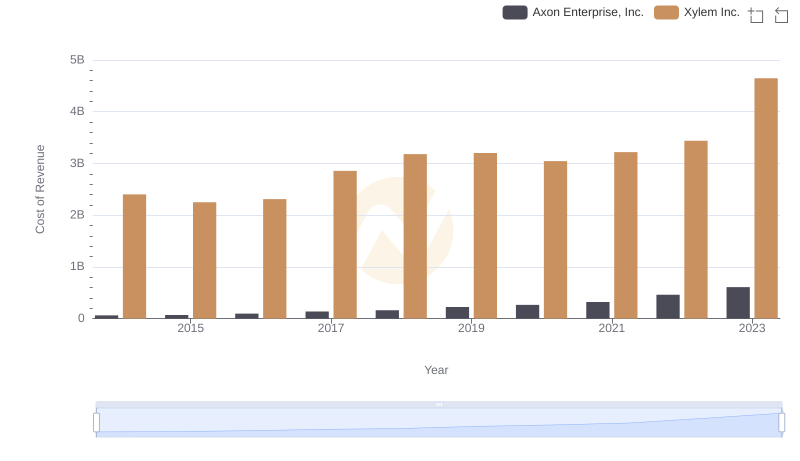
Comparing Cost of Revenue Efficiency: Axon Enterprise, Inc. vs Xylem Inc.
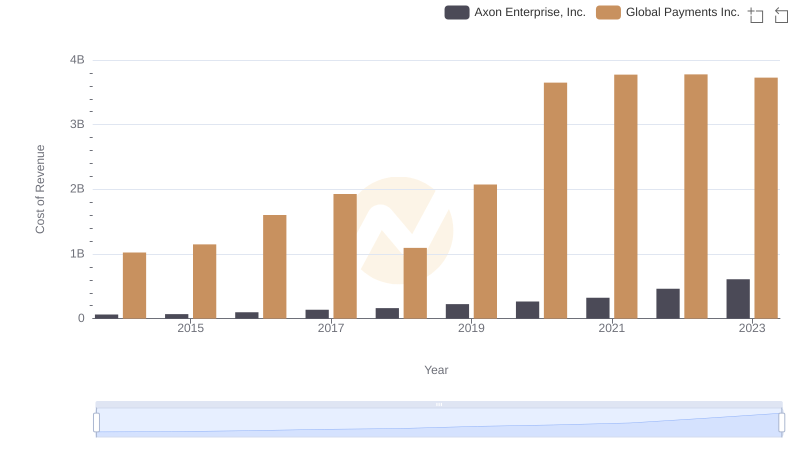
Cost Insights: Breaking Down Axon Enterprise, Inc. and Global Payments Inc.'s Expenses

Cost of Revenue Comparison: Axon Enterprise, Inc. vs Dover Corporation
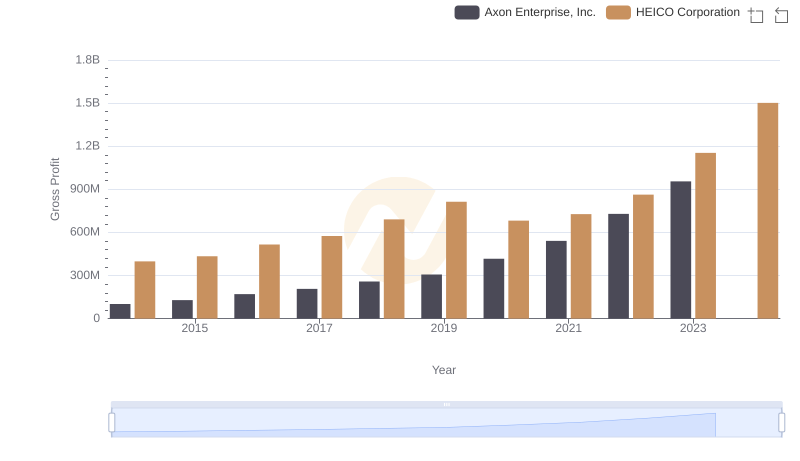
Gross Profit Analysis: Comparing Axon Enterprise, Inc. and HEICO Corporation
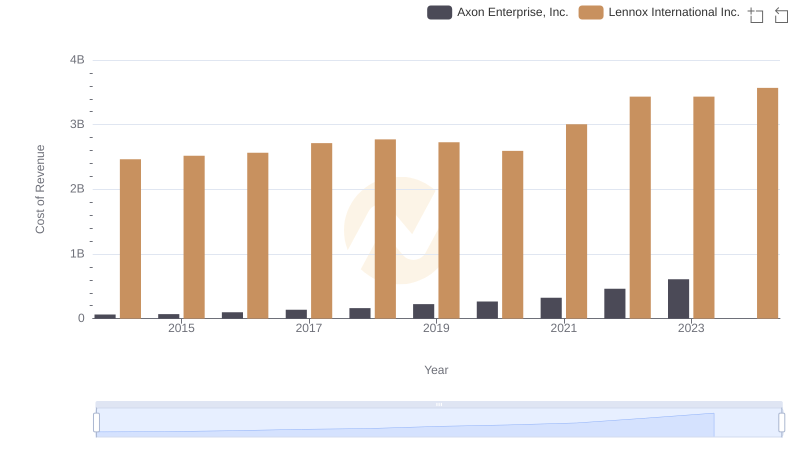
Cost of Revenue Trends: Axon Enterprise, Inc. vs Lennox International Inc.
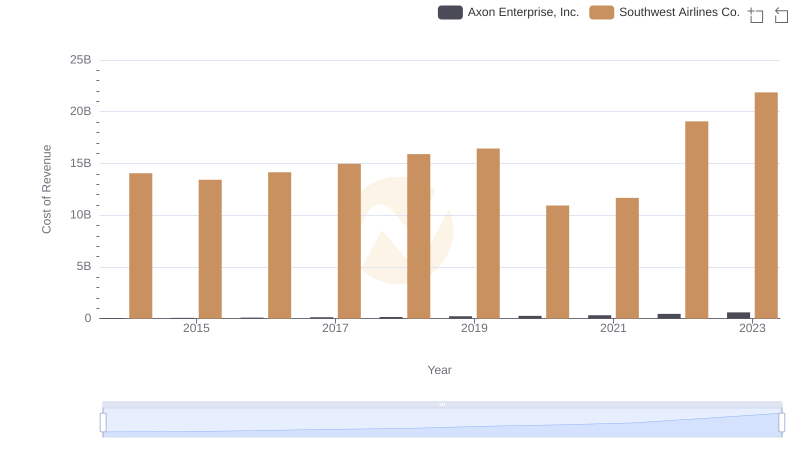
Cost of Revenue Trends: Axon Enterprise, Inc. vs Southwest Airlines Co.
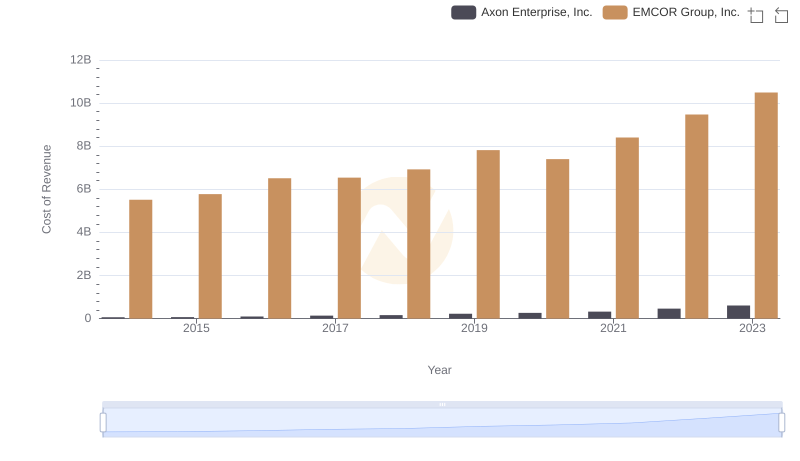
Cost of Revenue Comparison: Axon Enterprise, Inc. vs EMCOR Group, Inc.
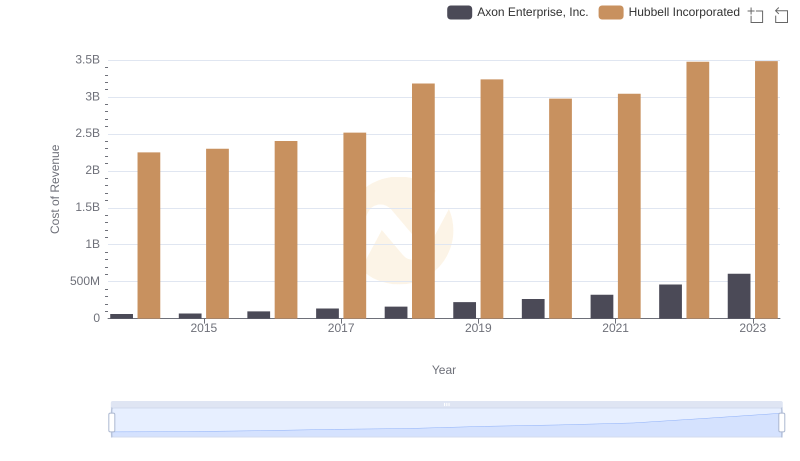
Analyzing Cost of Revenue: Axon Enterprise, Inc. and Hubbell Incorporated
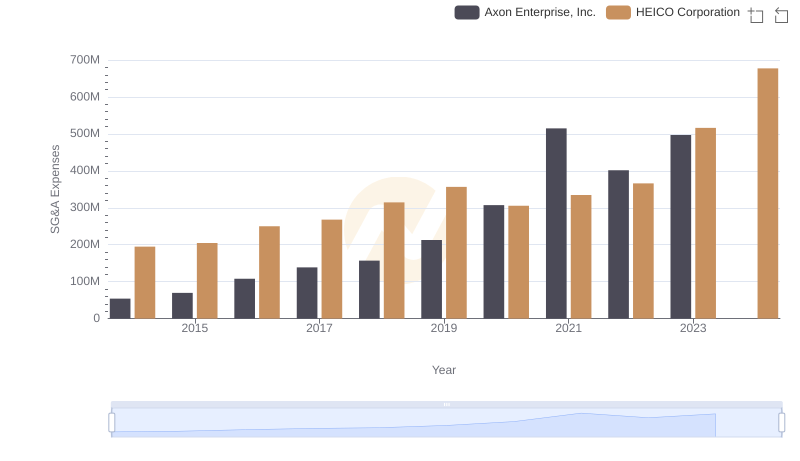
Operational Costs Compared: SG&A Analysis of Axon Enterprise, Inc. and HEICO Corporation