| __timestamp | Axon Enterprise, Inc. | Ferguson plc |
|---|---|---|
| Wednesday, January 1, 2014 | 164525000 | 22198928094 |
| Thursday, January 1, 2015 | 197892000 | 20800698973 |
| Friday, January 1, 2016 | 268245000 | 19066872795 |
| Sunday, January 1, 2017 | 343798000 | 20009463224 |
| Monday, January 1, 2018 | 420068000 | 20752000000 |
| Tuesday, January 1, 2019 | 530860000 | 22010000000 |
| Wednesday, January 1, 2020 | 681003000 | 21819000000 |
| Friday, January 1, 2021 | 863381000 | 22792000000 |
| Saturday, January 1, 2022 | 1189935000 | 28566000000 |
| Sunday, January 1, 2023 | 1563391000 | 29734000000 |
| Monday, January 1, 2024 | 29635000000 |
Data in motion
In the dynamic world of business, revenue generation is a key indicator of a company's success. This chart provides a fascinating comparison between Axon Enterprise, Inc. and Ferguson plc over the past decade. From 2014 to 2023, Ferguson plc consistently outperformed Axon Enterprise, Inc., generating approximately 10 times more revenue on average. In 2023, Ferguson plc reached a peak with nearly $30 billion in revenue, while Axon Enterprise, Inc. saw a significant growth, reaching $1.56 billion, marking a 850% increase from 2014. Despite Axon's impressive growth trajectory, Ferguson's dominance in revenue generation remains unchallenged. However, the absence of data for Axon in 2024 leaves room for speculation about its future performance. This comparison not only highlights the scale of Ferguson's operations but also underscores Axon's rapid growth in the competitive market landscape.
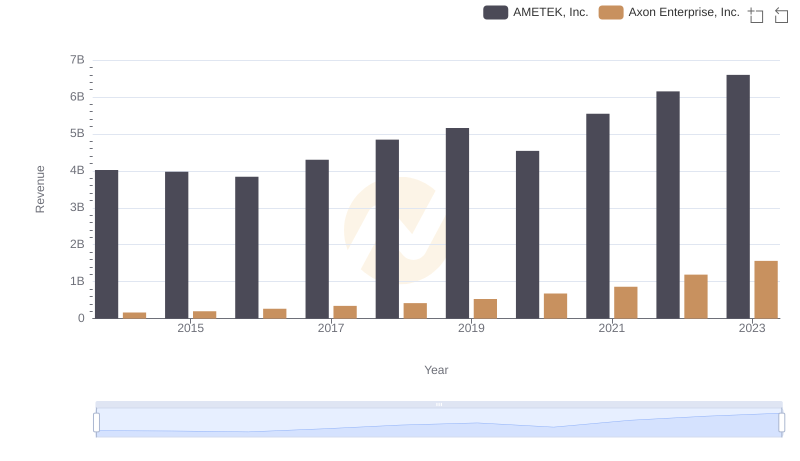
Annual Revenue Comparison: Axon Enterprise, Inc. vs AMETEK, Inc.
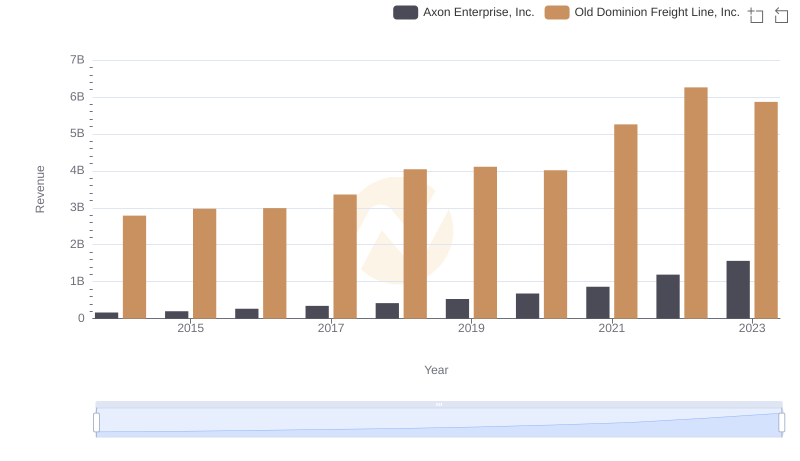
Comparing Revenue Performance: Axon Enterprise, Inc. or Old Dominion Freight Line, Inc.?
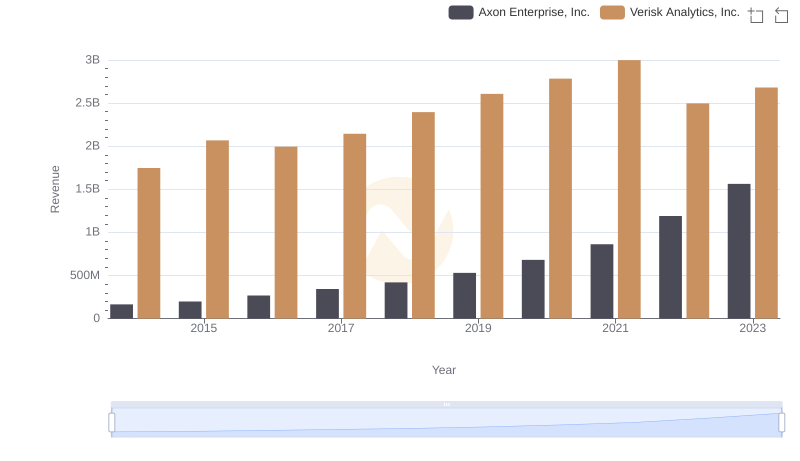
Axon Enterprise, Inc. or Verisk Analytics, Inc.: Who Leads in Yearly Revenue?
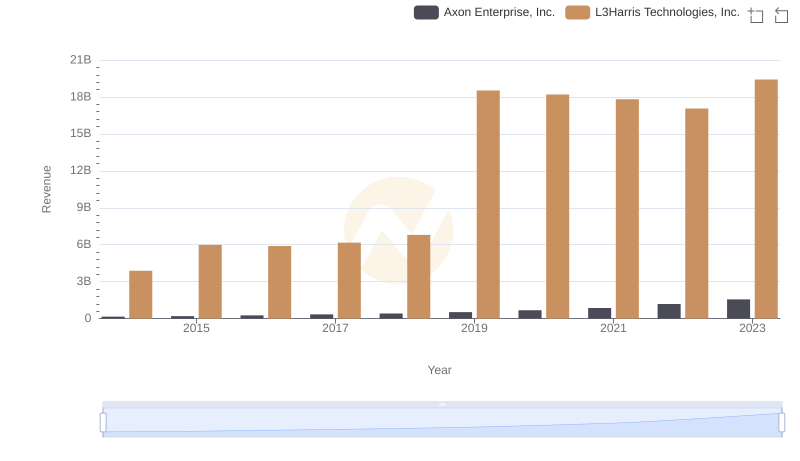
Annual Revenue Comparison: Axon Enterprise, Inc. vs L3Harris Technologies, Inc.
Axon Enterprise, Inc. vs Ingersoll Rand Inc.: Annual Revenue Growth Compared
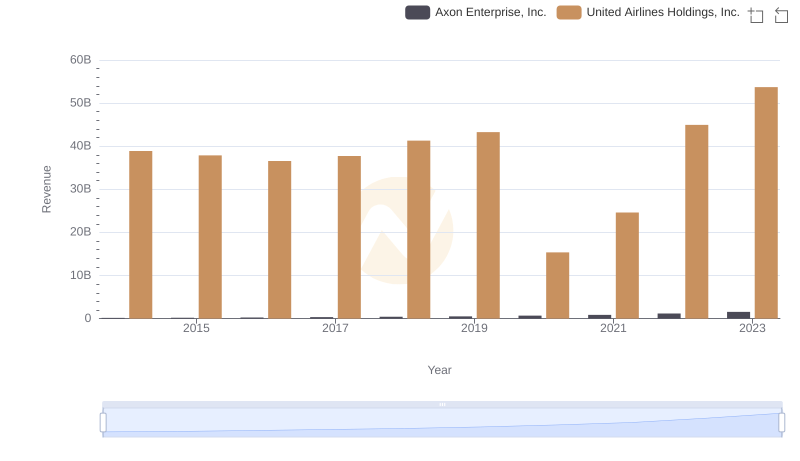
Annual Revenue Comparison: Axon Enterprise, Inc. vs United Airlines Holdings, Inc.
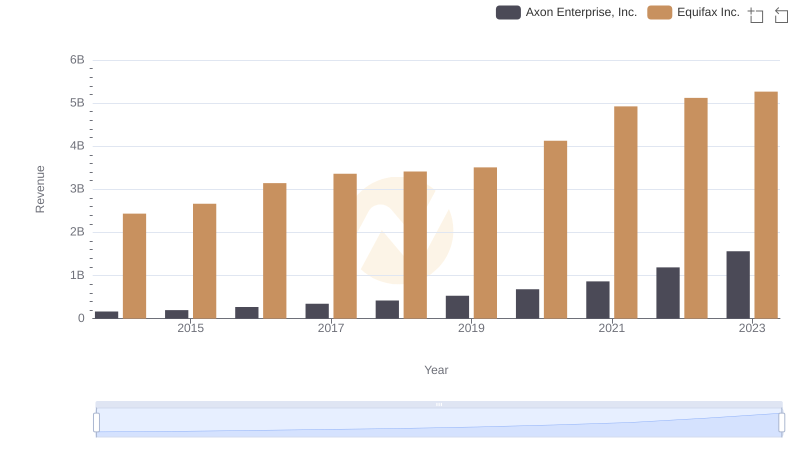
Annual Revenue Comparison: Axon Enterprise, Inc. vs Equifax Inc.
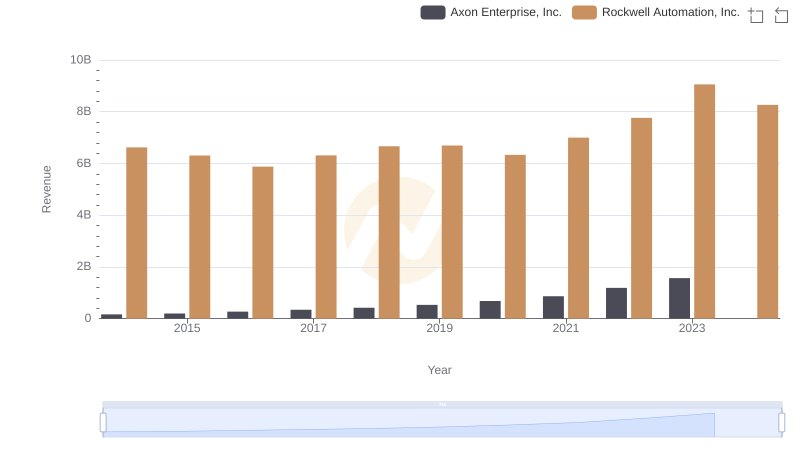
Axon Enterprise, Inc. vs Rockwell Automation, Inc.: Annual Revenue Growth Compared

Cost of Revenue Trends: Axon Enterprise, Inc. vs Ferguson plc

Key Insights on Gross Profit: Axon Enterprise, Inc. vs Ferguson plc
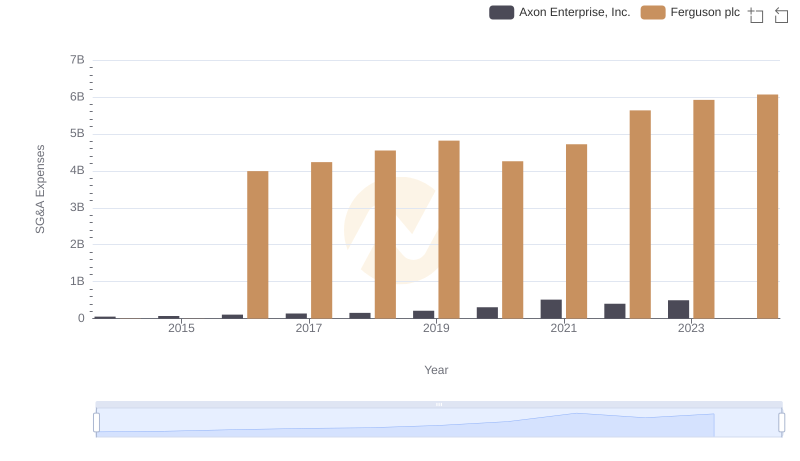
Axon Enterprise, Inc. or Ferguson plc: Who Manages SG&A Costs Better?