| __timestamp | Axon Enterprise, Inc. | Ferguson plc |
|---|---|---|
| Wednesday, January 1, 2014 | 101548000 | 6203188666 |
| Thursday, January 1, 2015 | 128647000 | 5816457079 |
| Friday, January 1, 2016 | 170536000 | 5389727937 |
| Sunday, January 1, 2017 | 207088000 | 5793596551 |
| Monday, January 1, 2018 | 258583000 | 6044000000 |
| Tuesday, January 1, 2019 | 307286000 | 6458000000 |
| Wednesday, January 1, 2020 | 416331000 | 6421000000 |
| Friday, January 1, 2021 | 540910000 | 6980000000 |
| Saturday, January 1, 2022 | 728638000 | 8756000000 |
| Sunday, January 1, 2023 | 955382000 | 9025000000 |
| Monday, January 1, 2024 | 9053000000 |
Cracking the code
In the dynamic world of business, understanding financial performance is crucial. This analysis delves into the gross profit trends of Axon Enterprise, Inc. and Ferguson plc from 2014 to 2023. Over this period, Ferguson plc consistently outperformed Axon, with gross profits peaking at approximately $9 billion in 2023, a 45% increase from 2014. In contrast, Axon Enterprise, Inc. showed remarkable growth, with gross profits surging by over 840%, reaching nearly $956 million in 2023. This impressive growth trajectory highlights Axon's expanding market presence. However, the data for 2024 is incomplete, indicating potential fluctuations. These insights underscore the importance of strategic financial planning and market adaptation in achieving sustained growth. As investors and analysts, understanding these trends can guide informed decision-making in the ever-evolving financial landscape.

Who Generates More Revenue? Axon Enterprise, Inc. or Ferguson plc

Cost of Revenue Trends: Axon Enterprise, Inc. vs Ferguson plc
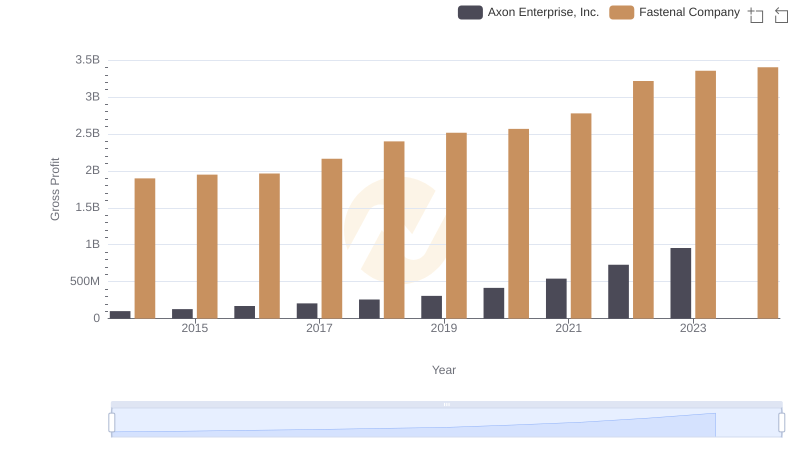
Axon Enterprise, Inc. and Fastenal Company: A Detailed Gross Profit Analysis
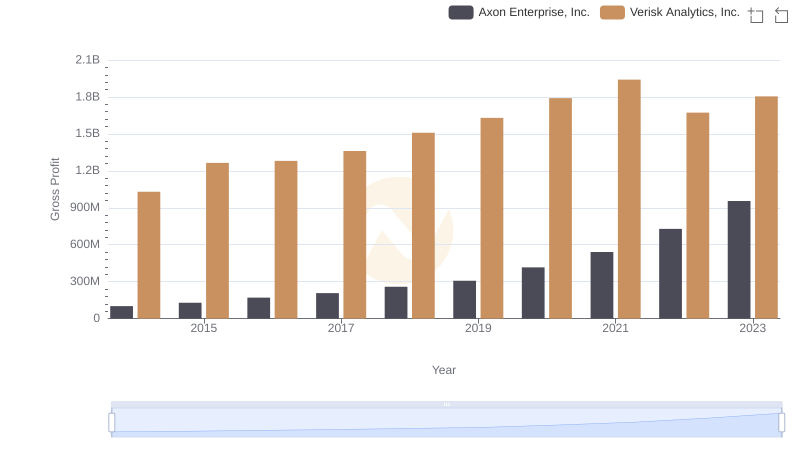
Gross Profit Trends Compared: Axon Enterprise, Inc. vs Verisk Analytics, Inc.
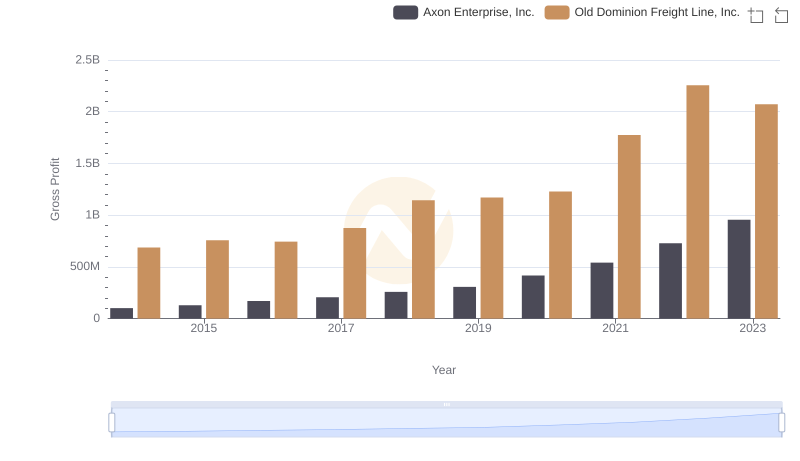
Axon Enterprise, Inc. vs Old Dominion Freight Line, Inc.: A Gross Profit Performance Breakdown
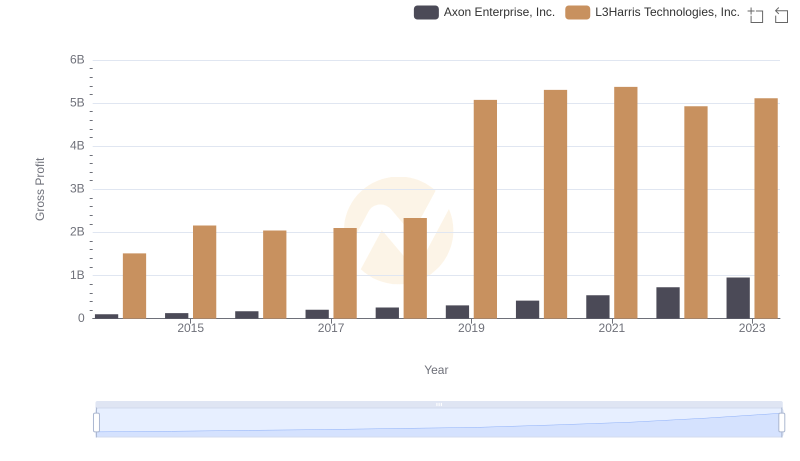
Axon Enterprise, Inc. vs L3Harris Technologies, Inc.: A Gross Profit Performance Breakdown

Gross Profit Trends Compared: Axon Enterprise, Inc. vs AMETEK, Inc.
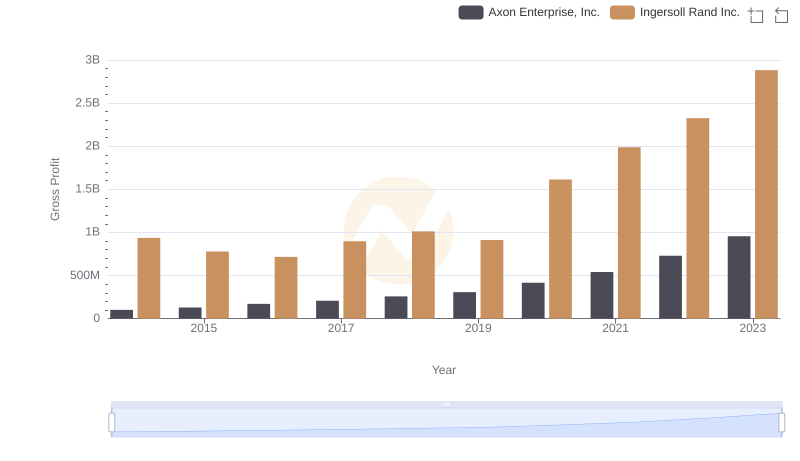
Axon Enterprise, Inc. and Ingersoll Rand Inc.: A Detailed Gross Profit Analysis
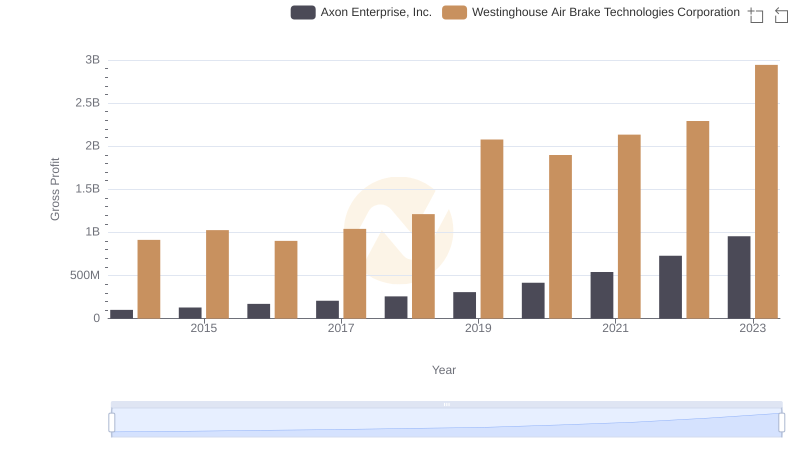
Key Insights on Gross Profit: Axon Enterprise, Inc. vs Westinghouse Air Brake Technologies Corporation
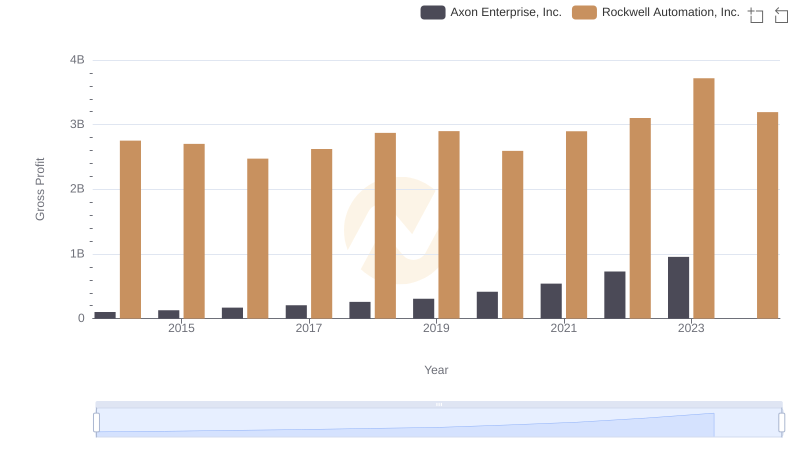
Axon Enterprise, Inc. and Rockwell Automation, Inc.: A Detailed Gross Profit Analysis
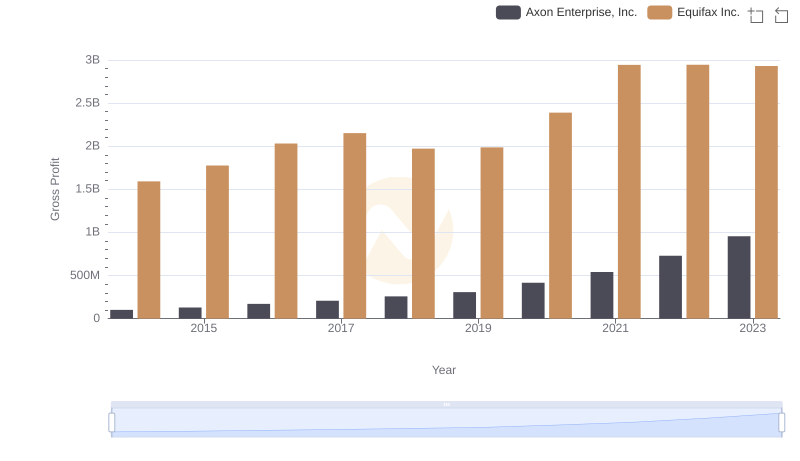
Who Generates Higher Gross Profit? Axon Enterprise, Inc. or Equifax Inc.
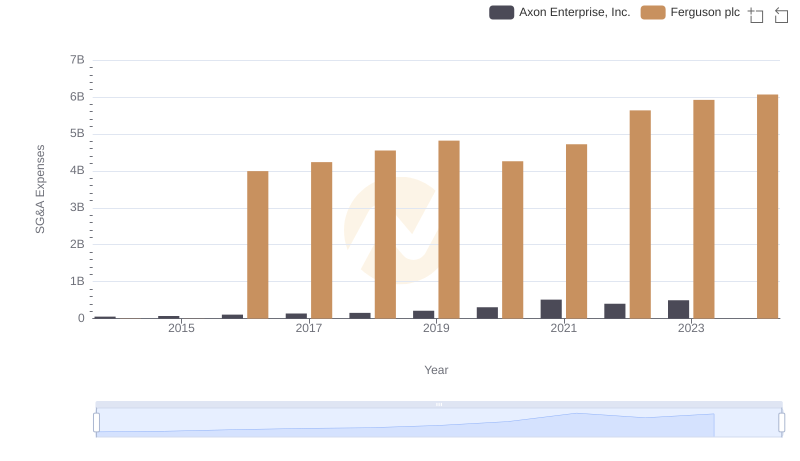
Axon Enterprise, Inc. or Ferguson plc: Who Manages SG&A Costs Better?