| __timestamp | 3M Company | Snap-on Incorporated |
|---|---|---|
| Wednesday, January 1, 2014 | 16447000000 | 1693400000 |
| Thursday, January 1, 2015 | 15383000000 | 1704500000 |
| Friday, January 1, 2016 | 15040000000 | 1720800000 |
| Sunday, January 1, 2017 | 16001000000 | 1862000000 |
| Monday, January 1, 2018 | 16682000000 | 1870700000 |
| Tuesday, January 1, 2019 | 17136000000 | 1886000000 |
| Wednesday, January 1, 2020 | 16605000000 | 1844000000 |
| Friday, January 1, 2021 | 18795000000 | 2141200000 |
| Saturday, January 1, 2022 | 19232000000 | 2311700000 |
| Sunday, January 1, 2023 | 18477000000 | 2488500000 |
| Monday, January 1, 2024 | 14447000000 | 2329500000 |
Unlocking the unknown
In the ever-evolving landscape of American industry, 3M Company and Snap-on Incorporated stand as titans in their respective fields. From 2014 to 2023, these companies have showcased distinct trajectories in their cost of revenue, a critical financial metric that reflects the direct costs attributable to the production of goods sold by a company.
3M Company, a global conglomerate known for its innovation, saw its cost of revenue fluctuate, peaking in 2022 with a 17% increase from 2014. However, 2024 data shows a significant drop, indicating potential strategic shifts or market challenges. In contrast, Snap-on Incorporated, a leader in professional tools, demonstrated a steady upward trend, with a remarkable 47% increase over the same period, highlighting its robust growth and market penetration.
This comparison not only underscores the dynamic nature of these industries but also offers insights into their operational efficiencies and market strategies.
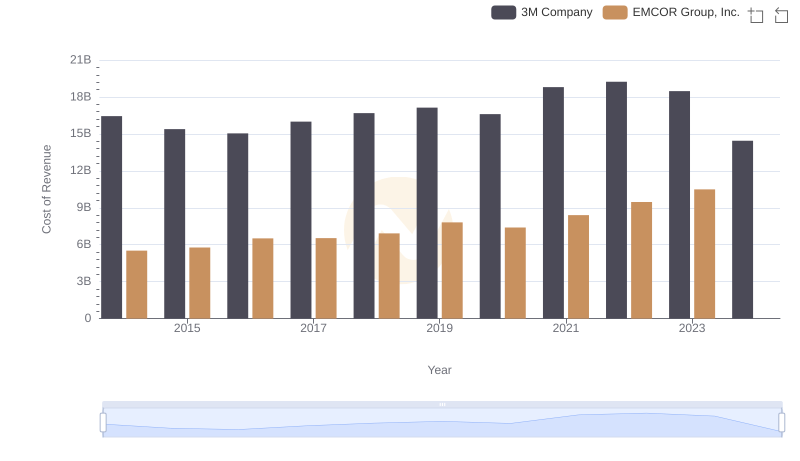
3M Company vs EMCOR Group, Inc.: Efficiency in Cost of Revenue Explored

Cost of Revenue Trends: 3M Company vs Watsco, Inc.
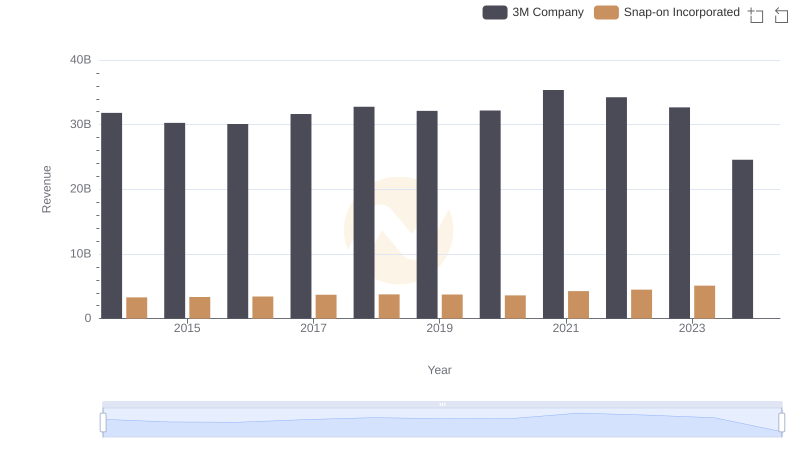
Revenue Showdown: 3M Company vs Snap-on Incorporated
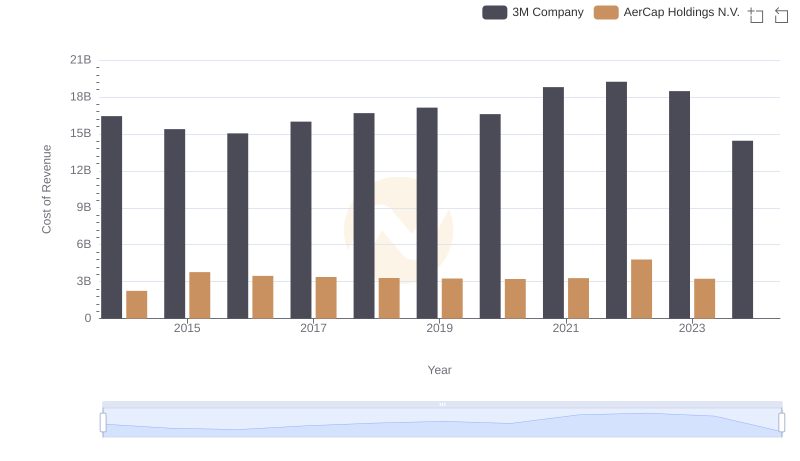
3M Company vs AerCap Holdings N.V.: Efficiency in Cost of Revenue Explored
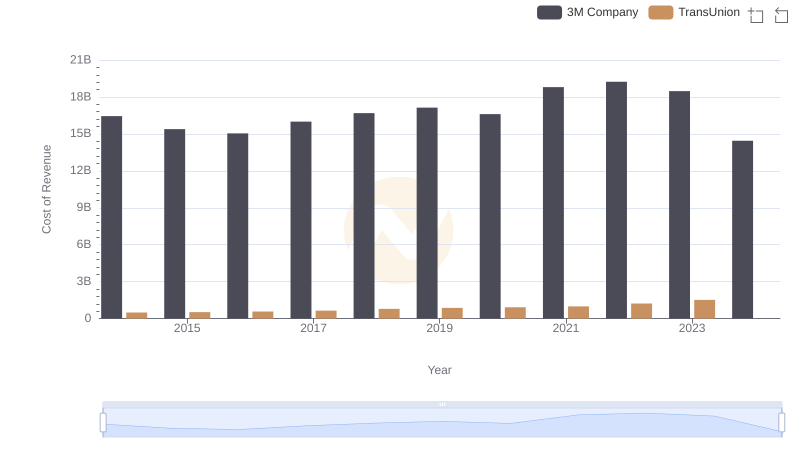
Analyzing Cost of Revenue: 3M Company and TransUnion
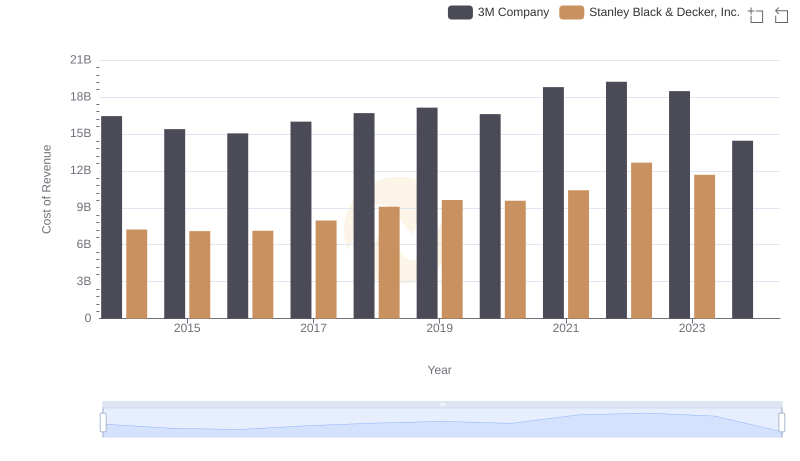
3M Company vs Stanley Black & Decker, Inc.: Efficiency in Cost of Revenue Explored
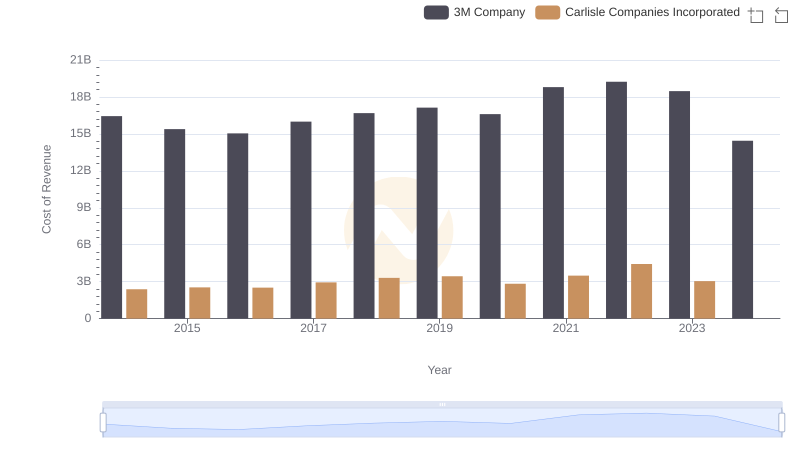
3M Company vs Carlisle Companies Incorporated: Efficiency in Cost of Revenue Explored
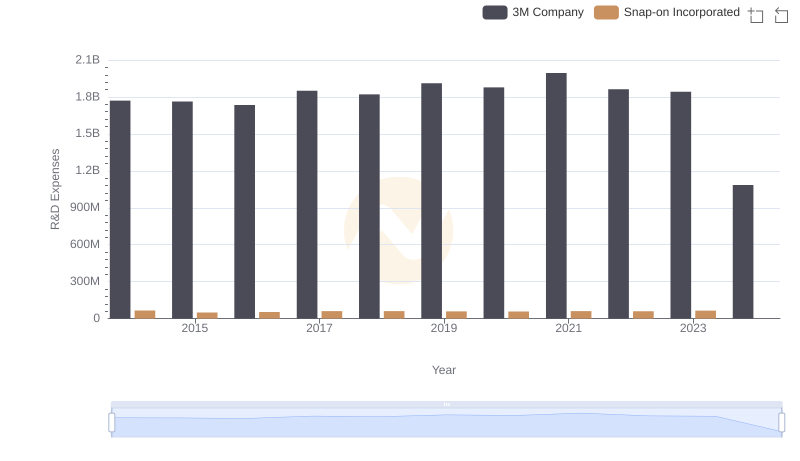
Who Prioritizes Innovation? R&D Spending Compared for 3M Company and Snap-on Incorporated