| __timestamp | 3M Company | EMCOR Group, Inc. |
|---|---|---|
| Wednesday, January 1, 2014 | 16447000000 | 5517719000 |
| Thursday, January 1, 2015 | 15383000000 | 5774247000 |
| Friday, January 1, 2016 | 15040000000 | 6513662000 |
| Sunday, January 1, 2017 | 16001000000 | 6539987000 |
| Monday, January 1, 2018 | 16682000000 | 6925178000 |
| Tuesday, January 1, 2019 | 17136000000 | 7818743000 |
| Wednesday, January 1, 2020 | 16605000000 | 7401679000 |
| Friday, January 1, 2021 | 18795000000 | 8401843000 |
| Saturday, January 1, 2022 | 19232000000 | 9472526000 |
| Sunday, January 1, 2023 | 18477000000 | 10493534000 |
| Monday, January 1, 2024 | 14447000000 |
Cracking the code
In the ever-evolving landscape of industrial giants, understanding cost efficiency is paramount. From 2014 to 2023, 3M Company and EMCOR Group, Inc. have showcased intriguing trends in their cost of revenue. Over this decade, 3M's cost of revenue has fluctuated, peaking in 2022 with a 15% increase from 2014, while EMCOR's costs have steadily risen, culminating in a remarkable 90% increase by 2023.
3M's cost efficiency reflects its strategic adjustments, with a notable dip in 2024, indicating potential operational shifts or market conditions. Conversely, EMCOR's consistent upward trend suggests robust growth and expansion, albeit with rising costs. The absence of data for EMCOR in 2024 leaves room for speculation on future strategies.
This analysis underscores the dynamic nature of cost management in the industrial sector, offering valuable insights for investors and industry enthusiasts alike.

Cost of Revenue Trends: 3M Company vs Watsco, Inc.
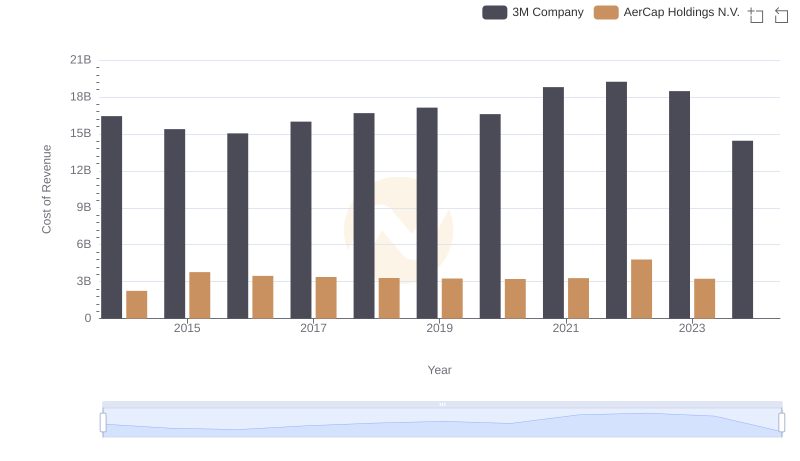
3M Company vs AerCap Holdings N.V.: Efficiency in Cost of Revenue Explored
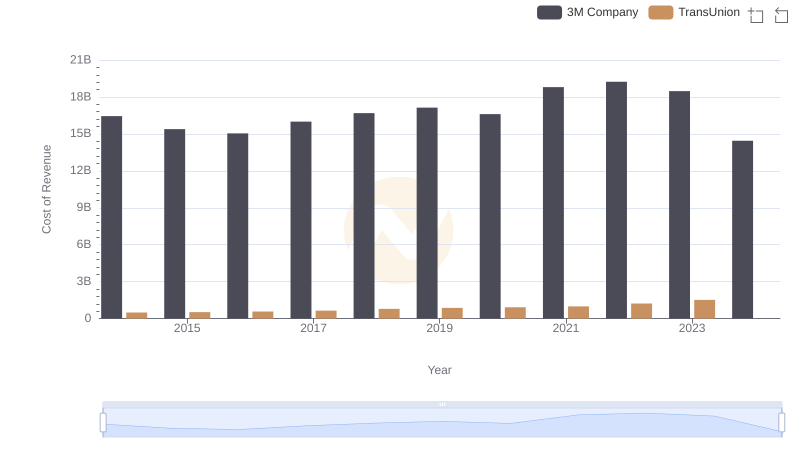
Analyzing Cost of Revenue: 3M Company and TransUnion
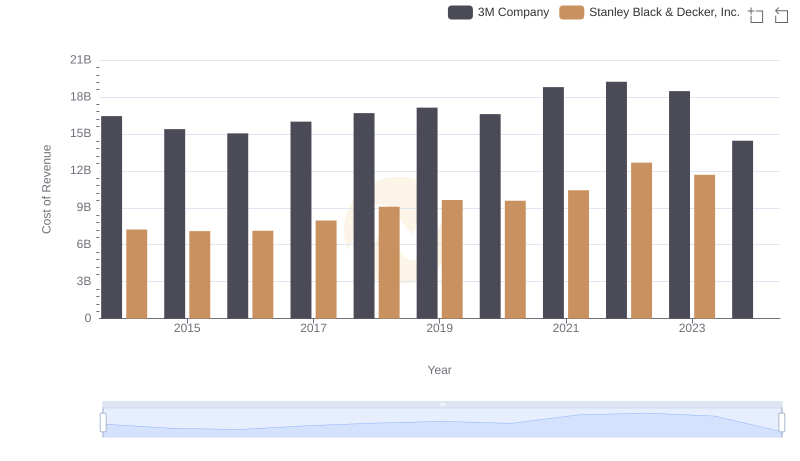
3M Company vs Stanley Black & Decker, Inc.: Efficiency in Cost of Revenue Explored
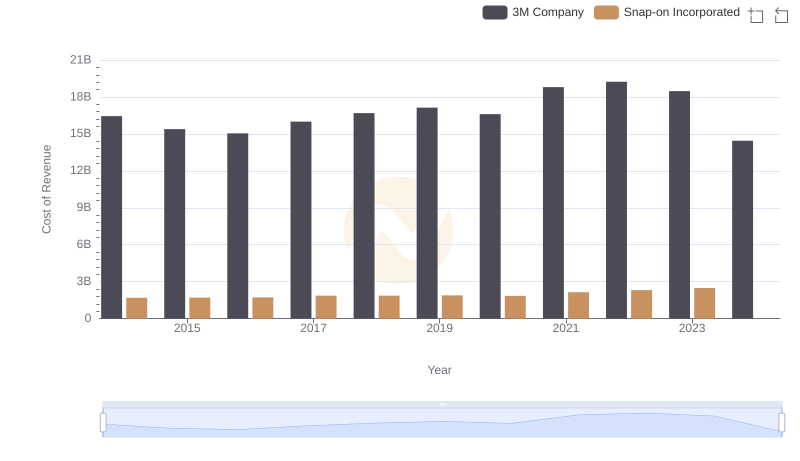
Cost of Revenue Comparison: 3M Company vs Snap-on Incorporated
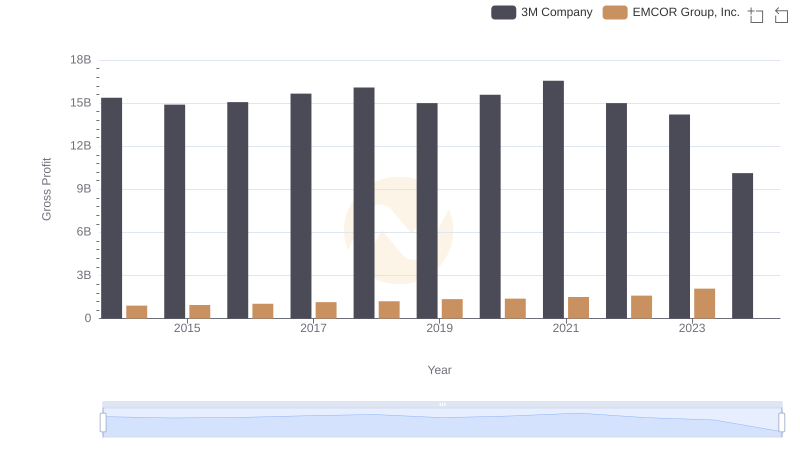
Who Generates Higher Gross Profit? 3M Company or EMCOR Group, Inc.
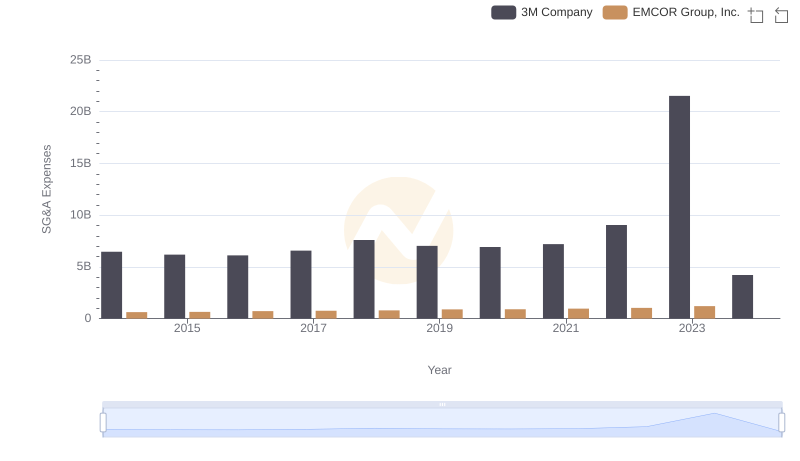
Who Optimizes SG&A Costs Better? 3M Company or EMCOR Group, Inc.