| __timestamp | 3M Company | AerCap Holdings N.V. |
|---|---|---|
| Wednesday, January 1, 2014 | 16447000000 | 2252878000 |
| Thursday, January 1, 2015 | 15383000000 | 3776407000 |
| Friday, January 1, 2016 | 15040000000 | 3465727000 |
| Sunday, January 1, 2017 | 16001000000 | 3377439000 |
| Monday, January 1, 2018 | 16682000000 | 3299635000 |
| Tuesday, January 1, 2019 | 17136000000 | 3259091000 |
| Wednesday, January 1, 2020 | 16605000000 | 3217133000 |
| Friday, January 1, 2021 | 18795000000 | 3287413000 |
| Saturday, January 1, 2022 | 19232000000 | 4805277000 |
| Sunday, January 1, 2023 | 18477000000 | 3237016000 |
| Monday, January 1, 2024 | 14447000000 |
In pursuit of knowledge
In the ever-evolving landscape of global business, cost efficiency remains a pivotal factor for success. This analysis delves into the cost of revenue trends for two industry giants: 3M Company and AerCap Holdings N.V., from 2014 to 2023. Over this decade, 3M Company consistently maintained a higher cost of revenue, peaking in 2022 with a 15% increase from 2014. In contrast, AerCap Holdings N.V. exhibited a more volatile pattern, with a notable 113% surge in 2022 compared to its 2014 figures. Interestingly, 2023 saw a decline for both companies, with 3M's costs dropping by 4% and AerCap's by 33% from the previous year. This fluctuation highlights the dynamic nature of cost management strategies in different sectors. Missing data for 2024 suggests a need for further analysis to understand future trends. Dive into the chart to explore these insights further.
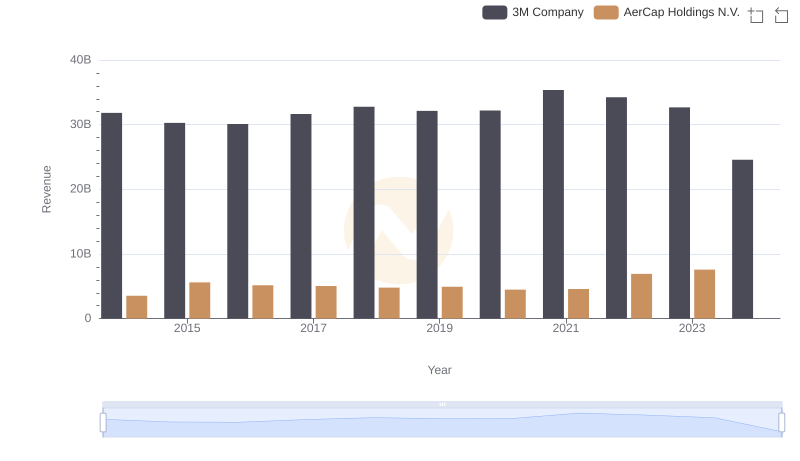
Annual Revenue Comparison: 3M Company vs AerCap Holdings N.V.
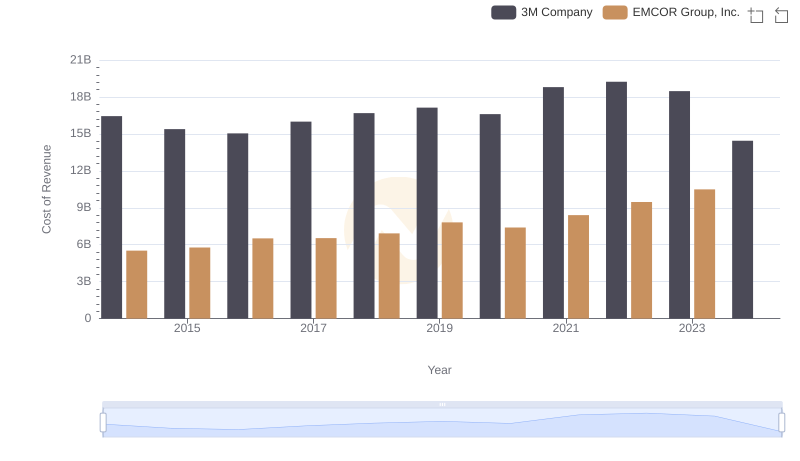
3M Company vs EMCOR Group, Inc.: Efficiency in Cost of Revenue Explored

Cost of Revenue Trends: 3M Company vs Watsco, Inc.
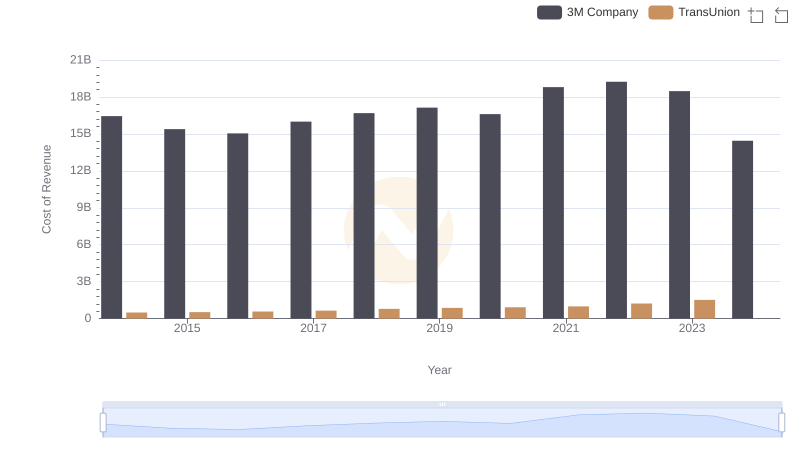
Analyzing Cost of Revenue: 3M Company and TransUnion
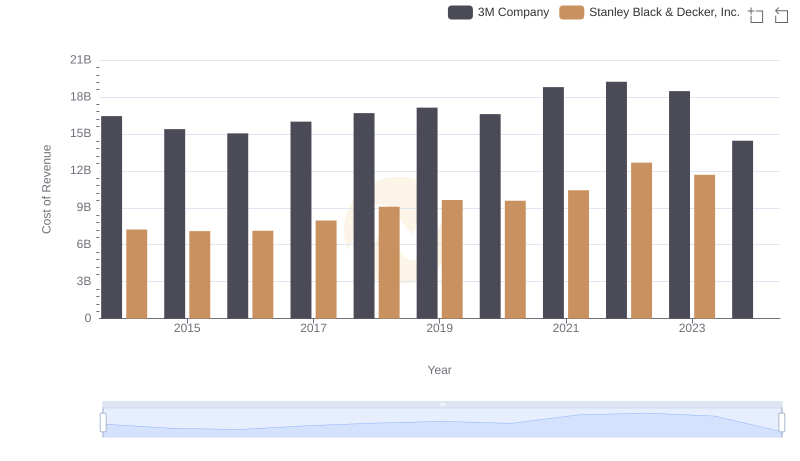
3M Company vs Stanley Black & Decker, Inc.: Efficiency in Cost of Revenue Explored
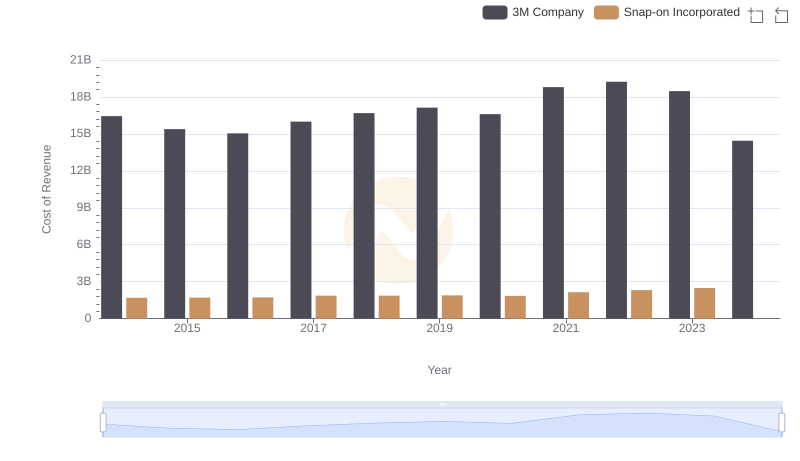
Cost of Revenue Comparison: 3M Company vs Snap-on Incorporated
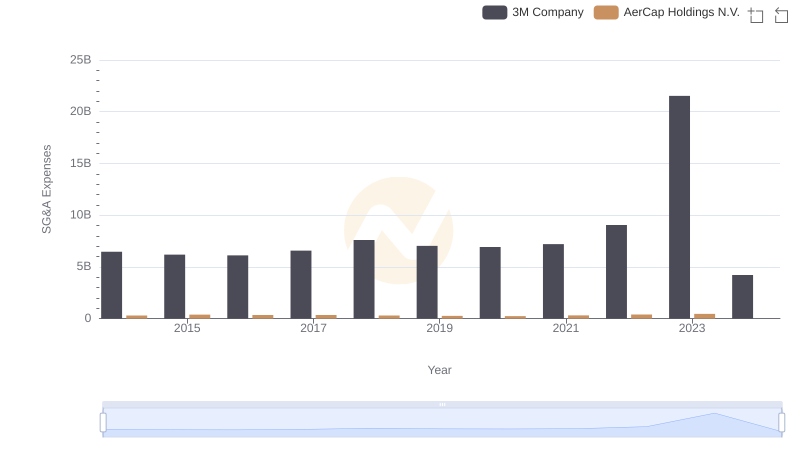
Who Optimizes SG&A Costs Better? 3M Company or AerCap Holdings N.V.